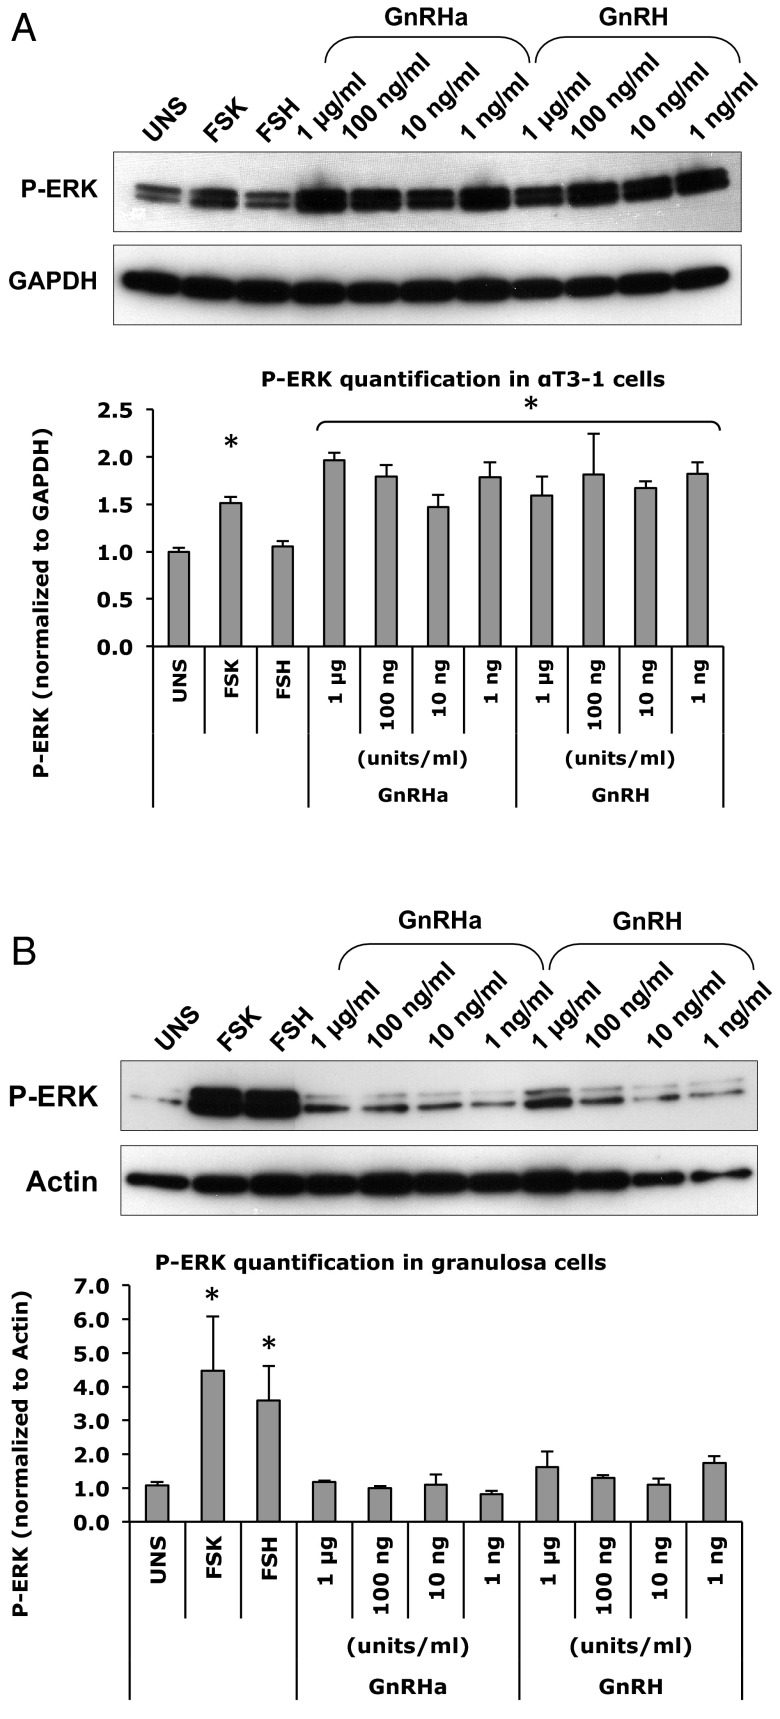
Figure 6.
Activation of ERK [pathway in response to forskolin (FSK; 10 μM), FSH (100 mIU/mL), GnRHa and GnRH (10−6 to 10−9 g/mL] as detected using Western blot analysis. αT3–1 cells are shown in A, and granulosa cells are shown in B. Antibody against p-ERK was used. The bar graphs depict the band intensity of the Western blots shown above, normalized for the endogenous gene. These graphs are based on 3 independent experiments, and a representative is shown here. UNS, unstimulated. *, indicates significant difference.

