
Figure 5.
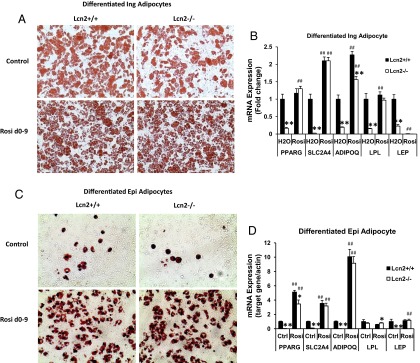
A, Oil-red O staining of inguinal SV cell cultures with or without Rosi treatment during the 9-day differentiation process. B, The mRNA expression of adipogenic genes in differentiated inguinal adipocytes with or without TZD treatment. C, The morphology of epididymal SV cell cultures with or without TZD treatment. D, The mRNA expression of adipogenic genes in differentiated epididymal adipocytes with or without TZD treatment. The morphological results of adipocytes (A and C) represents 4 independent experiments. Results of gene expression represent mean ± SE of 2 independent SV cell cultures from 4 animals per experiment. *, P < .05; **, P < .01, WT vs Lcn2−/−; #, P < .05; ##, P < .01, H2O vs Rosi. Abbreviation: Ctrl, control.