Figure 1.
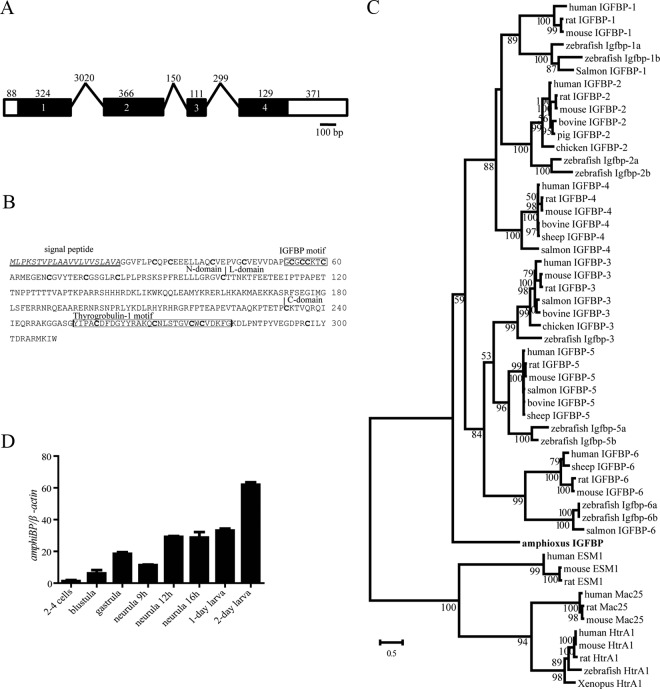
Amphioxus Has a Single IGFBP Expressed throughout Early Development. A, Schematic diagram of the amphioxus IGFBP gene. Black boxes represent the protein-coding region, open boxes represent the untranslated regions (UTR), and lines represent the introns. Numbers inside the boxes represent the exon number. The size (bp) of each exon and intron, respectively, is shown on the top. B, The amino acid sequence of amphioxus IGFBP. The predicted signal peptide is underlined. Vertical lines mark the boundaries between the N, L, and C domains. The characteristic IGFBP motif and thyroglobulin domain are boxed, and the conserved cysteine residues are marked in bold letters. C, Phylogenetic tree of IGFBPs. The full-length amino acid sequence of the indicated IGFBPs was aligned and analyzed by the Maximum Likelihood method. Mac25, HtrA1, and EMS1 were used as out groups. Numbers indicate bootstrap values for each node. D, Developmental expression profile of the amphioxus IGFBP gene. The amphioxus IGFBP mRNA levels were measured by qRT-PCR. The values are expressed as relative values to the β-actin mRNA levels. Values shown are means ± SE; n = 3.

