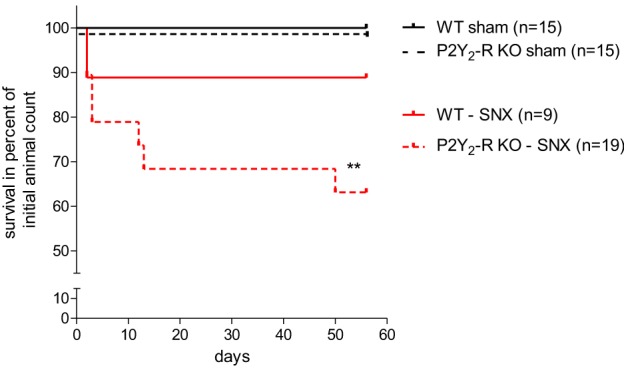
Figure 1.

Kaplan-Meyer-survival curve of all groups: sham surgery groups showed 100% survival after 56 ± 2 days. In the SNX surgery groups, more WT mice survived during the observation period than P2Y2-R KO mice (88.9 vs. 63.1%). Comparing this data to the sham surgery groups shows that subtotal nephrectomized P2Y2-R KO mice had a significantly reduced survival (**p < 0.01) whereas subtotal nephrectomized WT mice showed no significantly reduced survival compared to sham surgery WT mice (p = NS).
