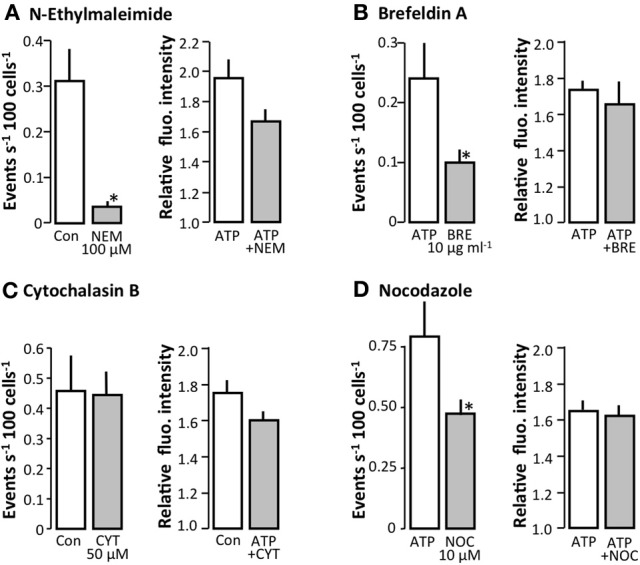
Figure 3.

The effect of various inhibitors of the exocytotic pathway on spontaneous [Ca2+]i events in MDCK cells. (A) The effect of N-ethylmalimide (NEM, 100 μM, n = 6), (B) Brefeldin A (BRE, 10 μg ml−1, n = 13), (C) Cytochalasin B (CYT, 50 μM, n = 5), and (D) Nocodazole (NOC, 10 μM, n = 7). The left hand side of the figures show the spontaneous [Ca2+]i events and the right hand side shows the response to the application of ATP (100 μM). All values are mean ± s.e.m. The asterisks indicate statistical significance.
