
Figure 7.
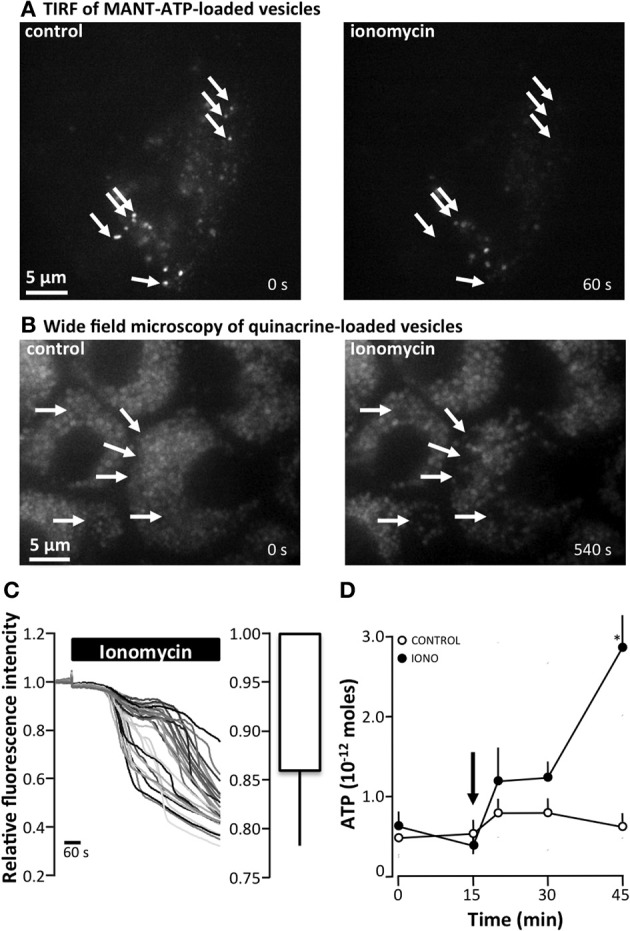
The effect of ionomycin on ATP release and vesicular fusion in MDCK cells (A) total internal reflection fluorescence (TIRF) microscopy of MDCK cells loaded with MANT-ATP (25 μM, 5 h, 37°C) showing vesicular fusion after the addition of ionomycin (1 μM). Arrows indicate vesicles that abruptly disappeared from the evanescence field. (B) Ionomycin (1 μM)-induced vesicular fusion as indicated by wide-field fluorescence microscopy of MDCK cells loaded with quinacrine (5 μM, 30 min, 37°C). Arrows indicate vesicles that display an abruptly drop in fluorescence. (C) Right: Original trace of the effect of ionomycin (1 μM, 37°C) on the relative fluorescence intensity of quinacrine-loaded MDCK cells. The left panel present the mean ± s.e.m. from 6 experiments. (D) ATP release from MDCK cells induced by apical application of ionomycin (IONO, 1 μM). The arrow indicates the addition of ionomycin or the control solution; the mean ± s.e.m. values are presented (n = 10). The asterisk indicates statistical significance.