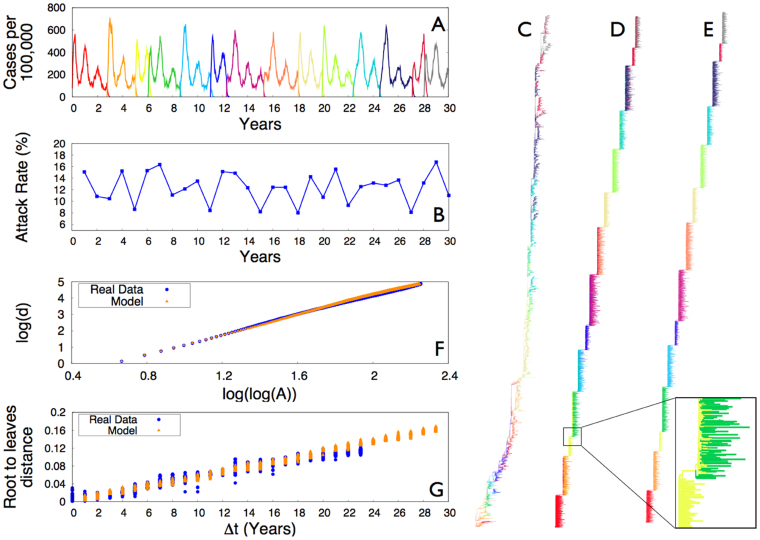
Figure 1. Infection pattern and phylogenetic properties.
(A) Number of infected hosts as a function of time, as predicted by the model. Different colors correspond to different antigenic clusters. The average duration time of a single cluster is 2.5 years, with an excursion from 1 to 4 years. (B) Annual attack rate, i.e., the fraction of the population infected each year, as predicted by the model. (C) Phylogenetic tree as reconstructed from the HA1 sequence of 6859 viruses isolated between 1988 and 2011 (see Supplementary Information for details). (D) and (E) Phylogenetic trees as reconstructed from the model sequences, with respective assignment of sequences to clusters as described in the main text. In the zoomed area of (D) we focus on the superposition of two colors in the transition between the 3rd and the 4th cluster, due to a wrong attribution of sequences to antigenic clusters (see main text for discussion). (F) Mean depth of the phylogenetic trees in Panels C and D (or equivalently E) as a function of the total number of internal nodes and leaves A. Model's predictions are in striking agreement with real data (see details in the Supplementary Information). (G) Root to leaves distances vs. time (see text for details). The model predictions are in remarkable quantitative agreement with results from real data. The substitution rate of new alleles, as measured from the slope of a straight line fitting the plot, is ρreal = 5.29 · 10−3 substitutions/site/year. The parameters of the model corresponding to all the presented results are (refer to the main text for the definitions): N = 105; L = 103; D = 4; σ = 0.6 μ = 4.16 · 10−3 mutations/site/year; ν = 1;  , with R0 = 2.0, α = 0.4, and T = 52;
  and
and  ; dt = 0.1.

