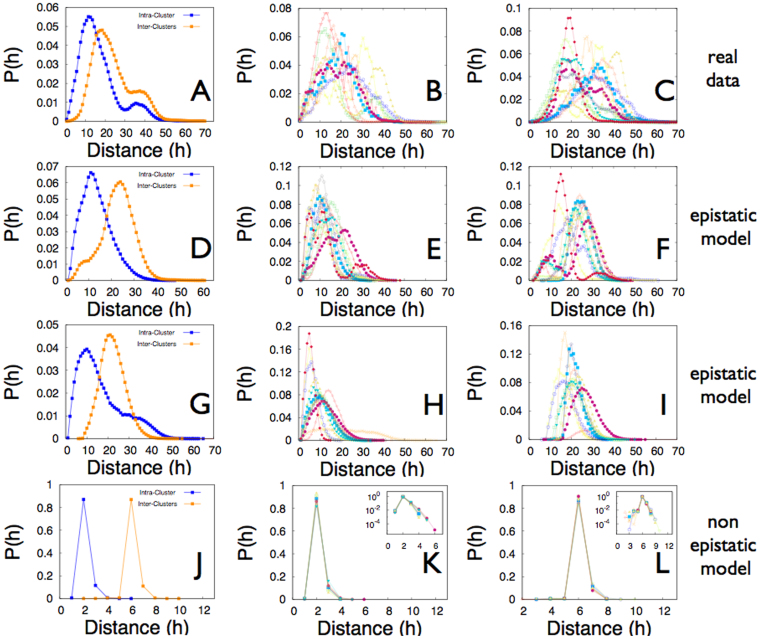
Figure 2. Properties of the antigenic clusters.
(A) Distributions of the Hamming distances h between any possible pairs of strains assigned to the same antigenic cluster (Intra-cluster), or any possible pairs of strains assigned to two consecutive clusters (Inter-clusters), as measured from the 987 nucleotides of the HA1 domain of the haemagglutinin gene (HA) of the 6859 viruses isolated between 1988 and 2011. The sequences' antigenic clusters are defined according to the vaccine composition recommendation for the correspondent year, as discussed in the main text. The plot is an average over all the available antigenic clusters. (B) Intra-clusters distributions for the same data as in A, separately reported for each antigenic cluster. (C) Inter-clusters distributions for the same data as in A, separately reported for each pair of consecutive antigenic clusters. (D) Same measures as in (A), for the strains produced by the epistatic model. Here the strains are associated to the antigenic cluster responsible for pandemics in their year of sampling. Panels (E) and (F) are the equivalent of panels B and C, for the model data analyzed in panels D. (G), (H), (I) Same data as (D,E,F) but with the strains associated with their actual antigenic cluster. Panels (J), (K), (L) Same data as (G,H,I) but for the non-epistatic (NE) model.

