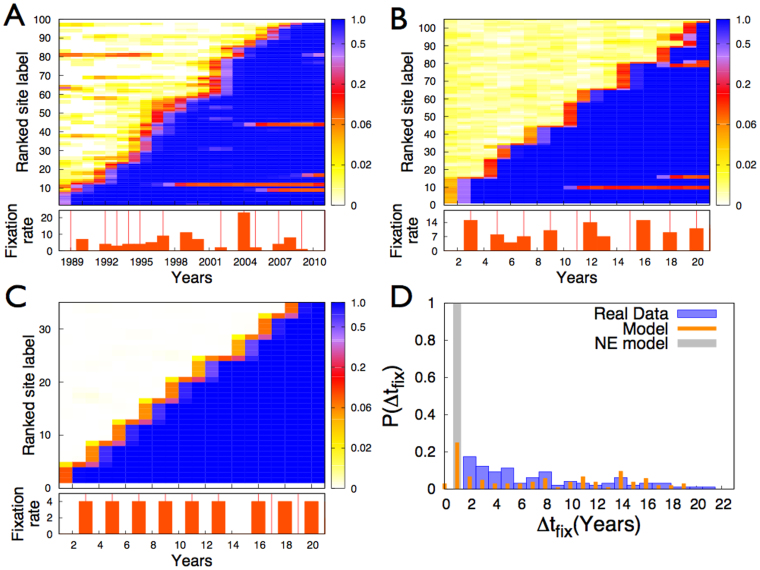
Figure 3. Patterns of fixations of nucleotide substitutions.
(A) Temporal map of new alleles frequencies for substitutions that undergo fixation, for the 987 nucleotides of the HA1 region of the haemagglutinin gene (HA) of 6859 viruses isolated between 1988 and 2011. (B) Same as A for the sequences generated by the model with epistasis. (C) Same as A for the sequences generated by the NE model. The temporal maps are constructed as follows: in the y-axes the label of each site corresponds to its rank with respect to the year of fixation, a lower number corresponding to an earlier fixation. With a color code is then shown, for each site of the detected substitutions, the allele frequency of the new allele that will undergo fixation, at each considered year (x-axes). The graphs below panels A, B and C report the number of substitutions fixed per year, both for real data and data model. Here vertical red lines mark transitions between antigenic clusters. (D) Histograms of the fixation times Δtfix for substitutions. Here the fixation time is defined as the timespan between the first occurrence of a substitution (defined as present in at least 1% of the circulating strains) to its fixation (defined as present in 95% of the circulating strains).

