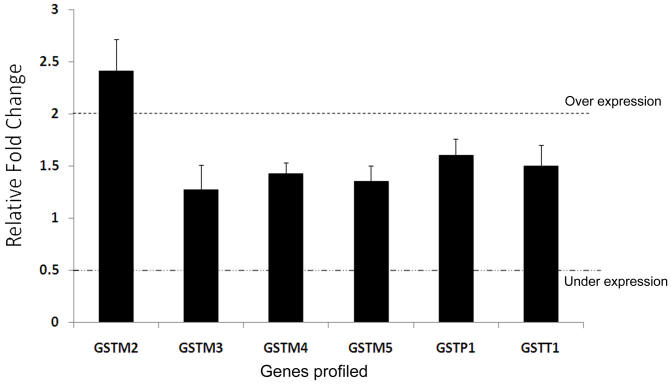
Figure 2. Gene expression profiling of GST enzymes.
Normalised gene expression profile (mean ± SEM) for GST family members in 15 GSTM1-null individuals with respect to the 15 age and sex-matched GSTM1-positive individuals. The significantly high GSTM2 expression (2.4 fold) under normal physiological conditions indicates a compensatory mechanism in the individuals completely lacking the GSTM1 enzyme.

