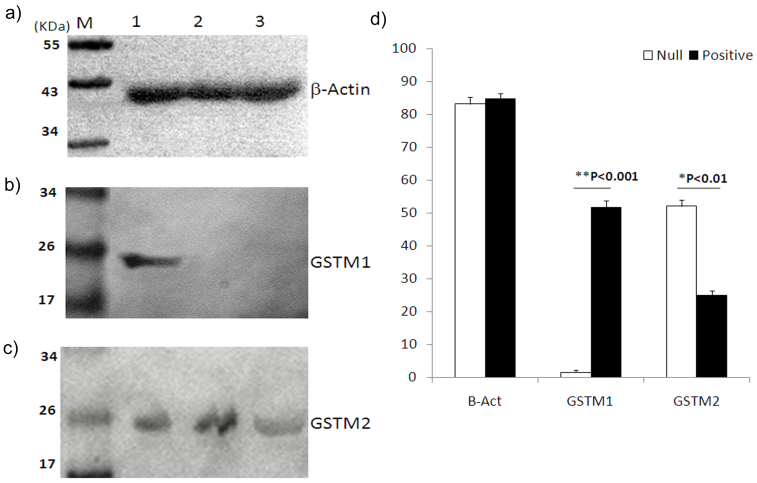
Figure 3. Western blot analysis reveals high GSTM2 expression in the GSTM1-null individuals.
Representative figure for (a) β-actin from one GSTM1 positive (Lane 1) and two null individuals (Lanes 2 and 3). (b) A GSTM1-positive individual showing a specific 26-kDa band for GSTM1, whereas no band is observed for the GSTM1-null individuals. (c) GSTM2 is present in all three individuals, though with various intensities. (d) A densitometric analysis (mean ± SEM; pixels/ng) of the target proteins in the western blot. A total of 17 GSTM1 null and 16 GSTM1 positive samples were analyzed. All the blots are representative cropped images and every set have been processed simultaenously, under similar conditions. Representative original blots with cropped demarcations (3b & 3c) are provided in supplementary figure 1.

