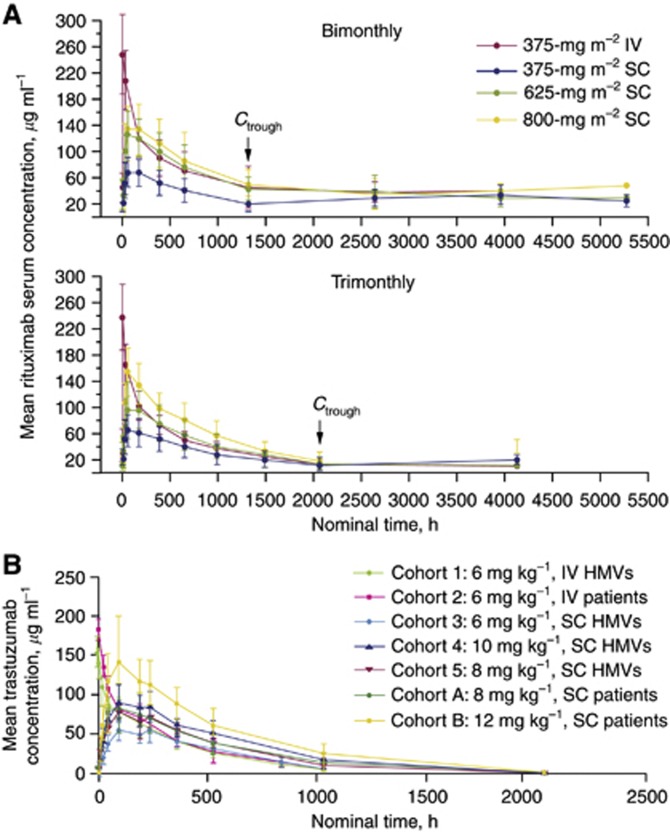
Figure 1.
(A) Mean serum concentration of rituximab over time by administration schedule (Salar et al, 2010). (B) Mean (±s.d.) trastuzumab concentration–time profile in (a) all cohorts, (b) HMVs and female patients receiving 6 mg kg−1 IV trastuzumab, and (c) cohorts with comparable SC and IV doses of trastuzumab. Abbreviations: HMVs, healthy male volunteers; IV, intravenous; SC, subcutaneous (Wynne et al, 2013).

