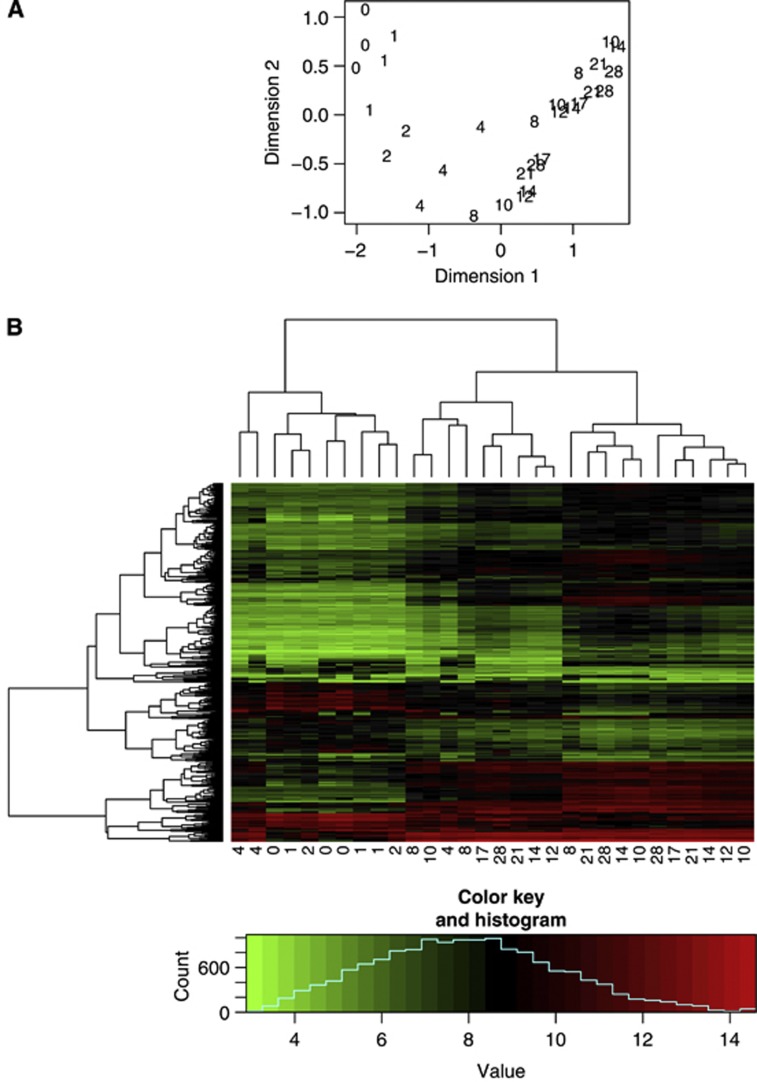
Figure 2.
Sample relationship in the normal airway time-course data. (A) Multidimensional scaling plot of the normal airway time-course data. The first dimension represents the HBEC-ALIC time points well. It suggests that the samples can be clustered into three stages of early, middle and late. (B) Heatmap of the bronchial time-course data based on the hierarchical clustering. Five hundred genes with the largest variability across samples were used. Columns are for samples and rows are for genes. The label for x axis is the days in culture. This plot further supports to cluster the 11 tHBEC-ALIC time points into three clusters. Days 0, 1, 2, 4 are the early stage; days 8, 10, 12 are the middle stage and days 14, 17, 21, 28 are the late stage.

