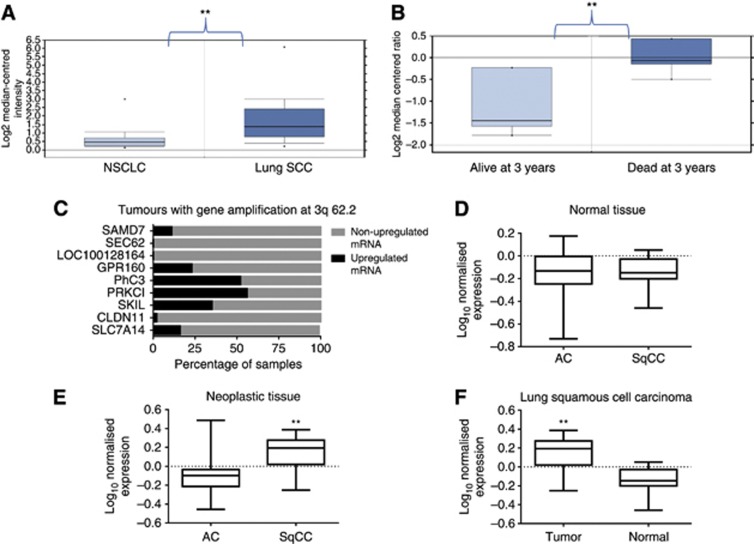
Figure 2.
PHC3 gene expression and amplification in lung cancers. (A) Correlation between PhC3 mRNA level and lung cancer histotype (138 patients from ‘Lee Lung' study). (B) Correlation between PhC3 mRNA level and 3-year survival in lung cancer (nine patients from ‘TCGA Lung' study). (C) Correlation between genomic amplification and mRNA levels in PHC3 and eight additional genes located at 3q62.2 (4 next to the 5′ end and 4 next to the 3′ end of the PHC3 locus, displayed from 5′ to 3′). The mRNA is considered upregulated when Z score is ⩾1.0. Data are from Cbio lung SCC data set. (D–F) Data from matched normal and neoplastic lung tissues. AC=adenocarcinoma (35 samples). SqCC=lung squamous cell carcinoma (13 samples). Data from A and C: Oncomine (Compendia Bioscience, Ann Arbor, MI) was used for analysis and visualisation. **P<0.01 (A and B, Oncomine analysis; D–F, two-sided t-test).

