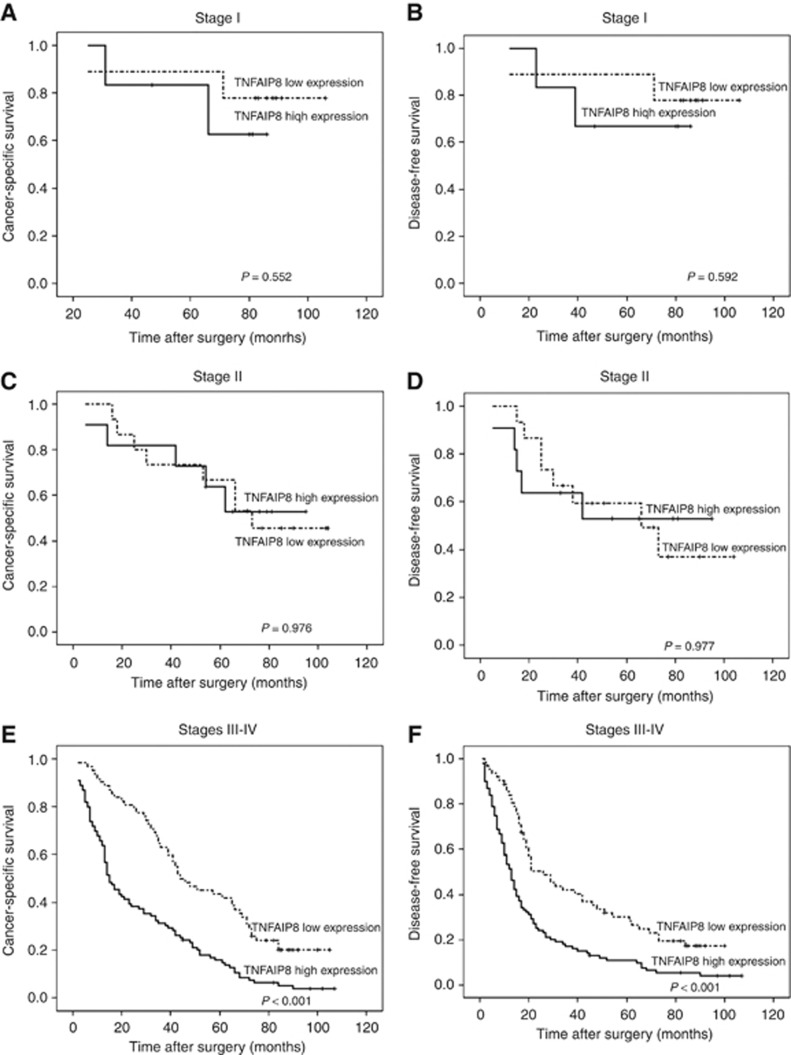
Figure 3.
A stage-stratified analysis of TNFAIP8 expression in patients with EOC. Survival curves showing the correlation of TNFAIP8 with CSS and DFS in EOC patients in different FIGO stages. (A) Cancer-specific survival in FIGO stage I. (B) Disease-free survival in FIGO stage I. (C) Cancer-specific survival in FIGO stage II. (D) Disease-free survival in FIGO stage II. (E) Cancer-specific survival in FIGO stage III–IV. (F) Disease-free survival in FIGO stage III–IV.

