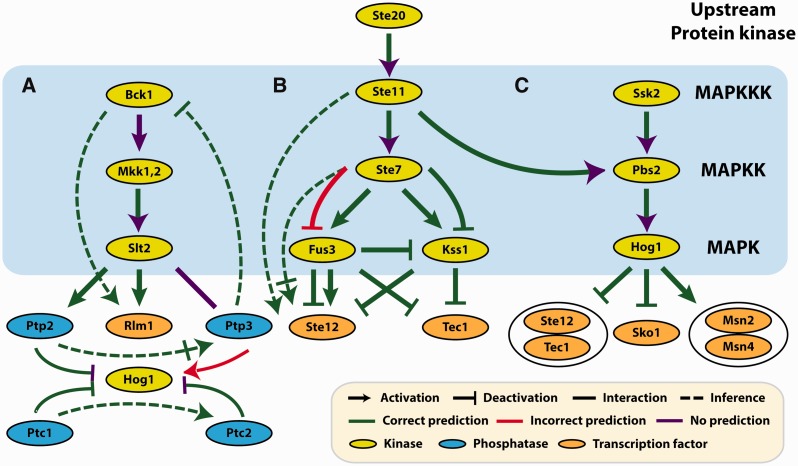
Fig. 2.
PhosphoChain MAPK reconstruction. The MAPK pathway separated into (A) the Bck1-Slt2 and Hog1 pathways, (B) the Ste20-Fus3 and Ste20-Kss1 pathways and (C) the Ssk2-Hog1 pathway. A dashed green line means that PhosphoChain predicts a known undirected interaction to be activation or deactivation. A solid green line with a purple arrowhead means that PhosphoChain predicts an interaction with no direction. These predicted interactions are the same regardless of whether or not the GRA algorithm (Section 2.3.2) is run

