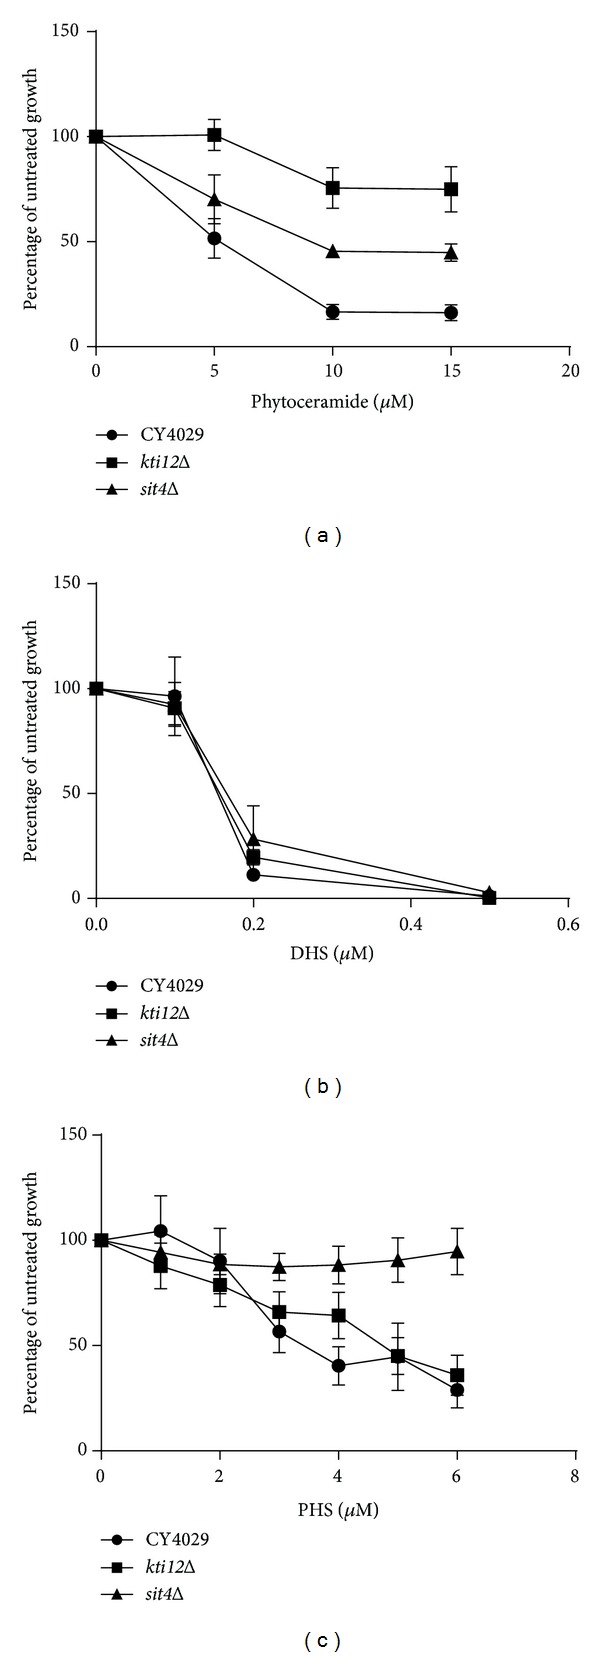
Figure 3.

Response of sit4Δ and kti12Δ mutants to phytoceramide and long chain bases. Yeast cultures were diluted to 5 × 10³ cells/mL in YPD with the addition of the indicated concentrations of (a) phytoceramide, (b) dihydrosphingosine (DHS), (c) phytosphingosine (PHS), or an equal volume of ethanol. Cells were grown until the untreated culture reached exponential phase and then the OD600 of both treated and untreated cells was measured and plotted as a percentage of untreated growth. Raw OD600 values are given in Supplementary Table 2. A minimum of three replicates are shown and error bars represent the standard error above and below the mean. A Student's t-test was used to determine if the mutants showed a significant difference in growth compared to the wild type (CY4029) at each concentration shown.
