
Fig. 4.
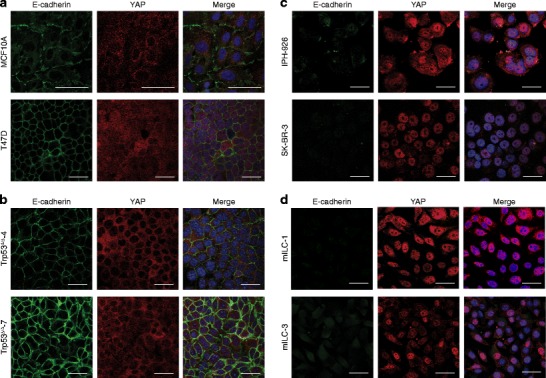
Nuclear localization of YAP in human and mouse ILC. Immunofluorescence for E-cadherin (left panels, green) and YAP (YAP-IF, middle panels, red). Nuclei were visualized using DAPI (blue). Right panels depict the merged image. In E-cadherin positive human (a) and mouse (b) cell lines YAP expression is predominantly cytosolic. E-cadherin negative human (c) and mouse ILC (d) cell lines are characterized by prominent nuclear YAP expression. Size bar = 15 μm