
Fig. 1.
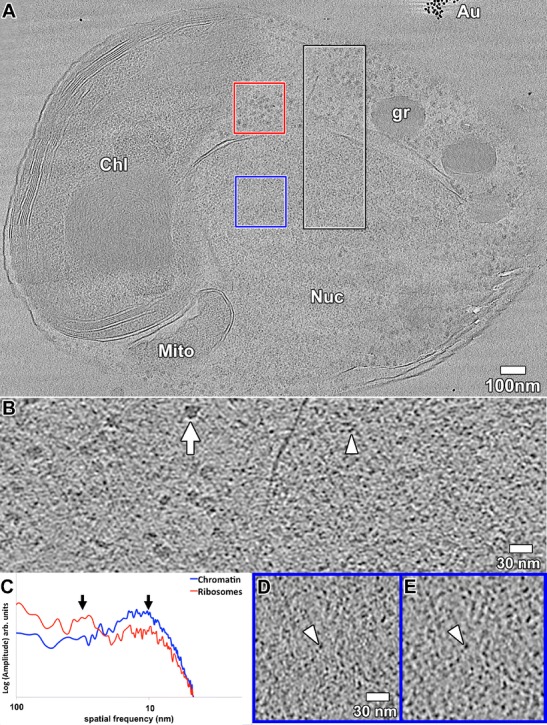
O. tauri chromatin is not organized as 30-nm fibers. a Tomographic slice, 60 nm thick, through a cryosection of a mitotic O. tauri cell. The intranuclear spindle microtubules are not located in this slice. The nucleus (Nuc), chloroplast (Chl), mitochondrion (Mito), a granule (gr), and gold fiducials (Au) are labeled. A position including either chromatin (blue) or cytoplasmic ribosomes (red) was selected for Fourier analysis. The semiperiodic horizontal structures (most visible in the left side of the chloroplast) are crevasses from cryomicrotomy. b A 10-nm-thick tomographic slice corresponding to the black/white box in a, enlarged 3-fold and rotated 90° counterclockwise. A cytoplasmic ribosome is indicated by the arrow and an intranuclear nucleosome-sized density is indicated by the arrowhead. c Rotationally averaged amplitudes (log scale, arbitrary units) of the Fourier transform of the two color-coded positions boxed in a. Arrows point to the ~30-nm (1/30 nm−1) (left) and 10-nm (1/10 nm−1) (right) spatial frequencies. A 10-nm-thick tomographic slice corresponding to the blue box in a is shown, enlarged 3-fold, either d unmodified or e with a Gaussian-shaped bandpass filter centered at 10 nm (1/10 nm−1). The arrowhead points to an example nucleosome-sized density. Note that image compression artifacts make the chromatin densities look smaller than in the original, uncompressed image