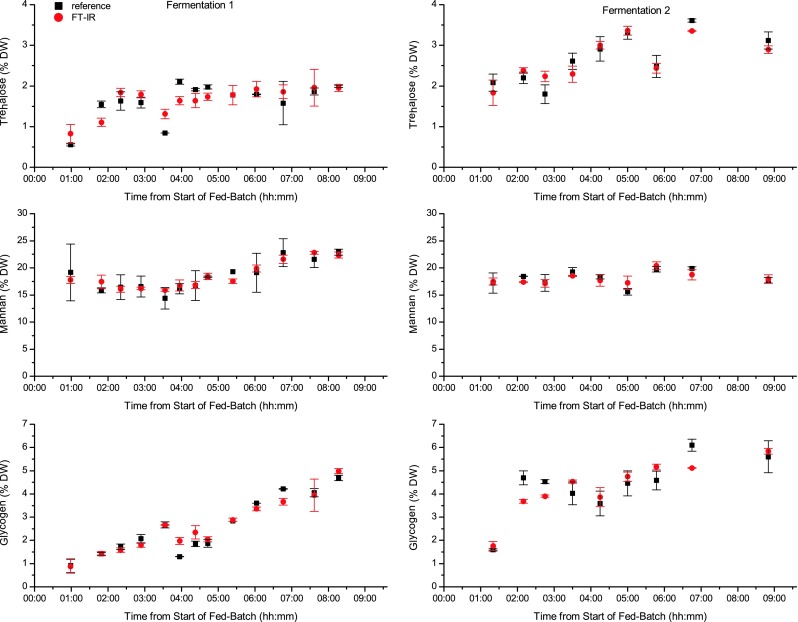
Fig. 5.

Relative trehalose, mannan, and glycogen content of the samples drawn from fermentations 1 and 2 at different times determined by reference analysis (black squares) and from FT-IR spectra by cross-validated PLS regression (red circles)

Relative trehalose, mannan, and glycogen content of the samples drawn from fermentations 1 and 2 at different times determined by reference analysis (black squares) and from FT-IR spectra by cross-validated PLS regression (red circles)