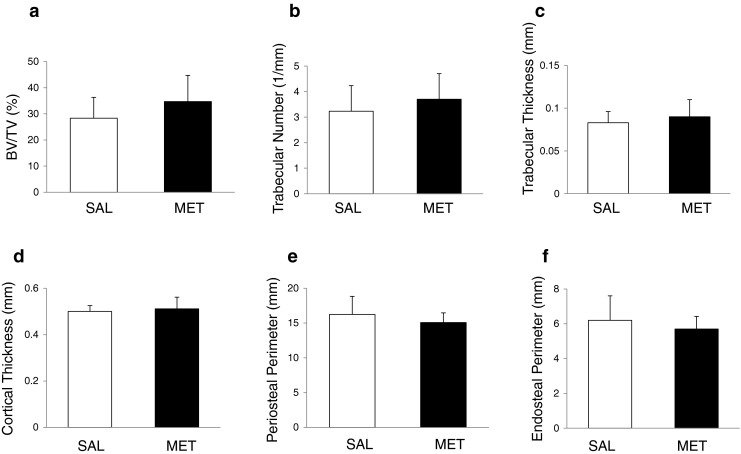
Fig. 4.

Effect of metformin on trabecular and cortical bone parameters in rat tibia aged 5 months treated with saline and metformin during 8 weeks. a, b, c Three-dimensionally computed BV/TV (a), trabecular number (b) and trabecular thickness (c) were assessed by micro-CT in the proximal tibial metaphysis of saline- and metformin-treated rats. d, e, f Two-dimensionally computed cortical thickness (d), periosteal perimeter (e) and endosteal perimeter (f) were assessed by micro-CT in the mid-diaphysis of cortical bone in saline- and metformin-treated rats. Bars represent mean ± SD of n = 9 rats/group
