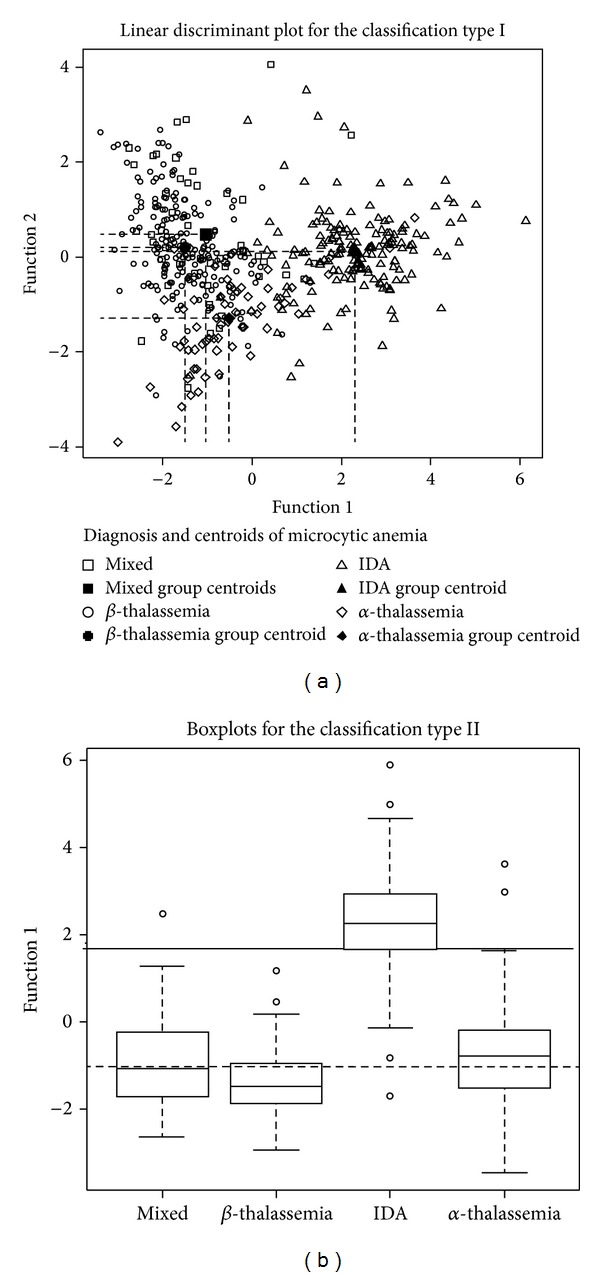
Figure 1.

Linear discrimination plot for the studied classification type I (a) and boxplot for the classification type II in the training set (b). Black symbols in the linear discriminant plot indicate centroid groups. Dashed line in the boxplot reflects the cut-off value for the required discriminant function.
