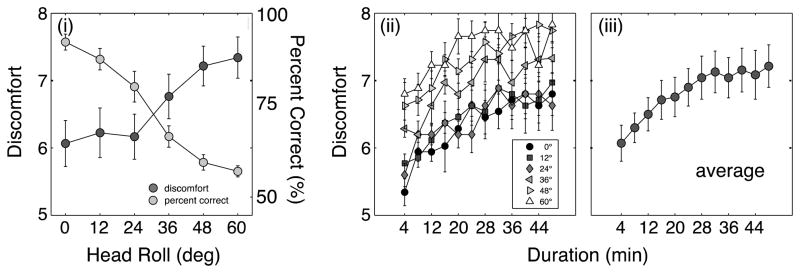
Figure 5.

(i) Discomfort and percent correct as a function of the angle of head roll. Scores have been averaged across subjects. (ii) Discomfort scores as a function of time. Different symbols depict the scores in the different head roll conditions. Scores have been averaged across subjects. (iii) Discomfort averaged across all the head roll conditions.
