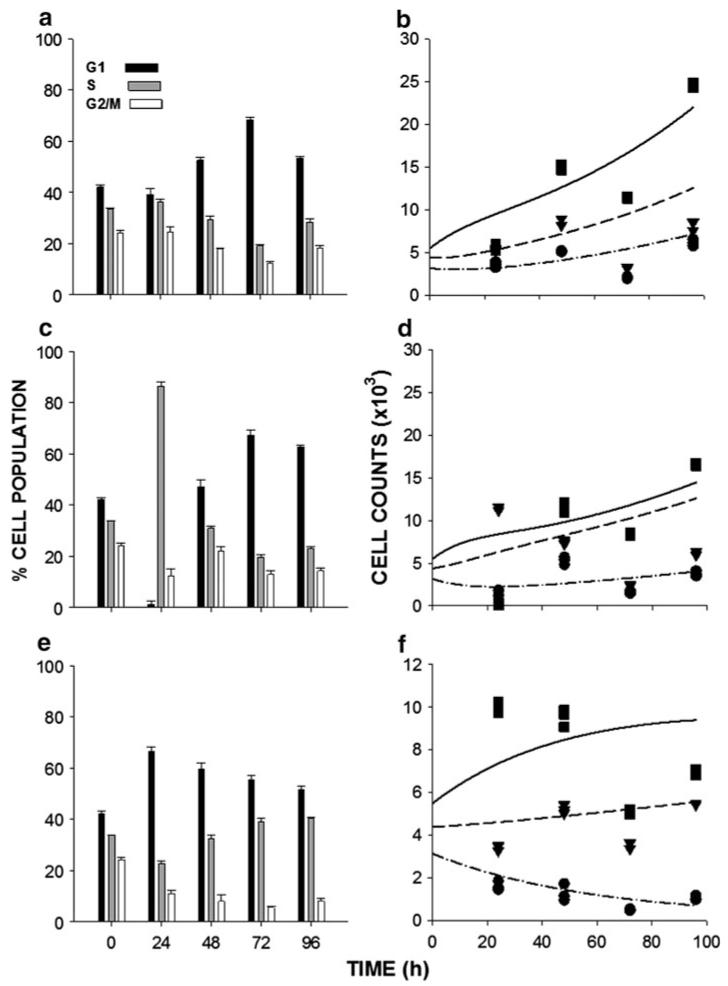
Fig. 3.
Cell cycle-phase distributions of BxPC-3 exposed to a 0.1 ng/mL, c 1 ng/mL, and e 100 ng/mL gemcitabine for up to 96 h. b, d, and f show the corresponding number of cells per well in each cycle phase (squares-G1, triangles-S, circles-G2/M) and the model fittings (lines). Units of the ordinate are cells per well ×103. Each time point consisted of three replicates

