Abstract
Radiation dose has raised significant concerns to patients and operators in modern x-ray computed tomography (CT) examinations. A simple and cost-effective means to perform a low-dose CT scan is to lower the milliampere-seconds (mAs) as low as reasonably achievable in data acquisition. However, the associated image quality with lower-mAs scans (or low-dose scans) will be unavoidably degraded due to the excessive data noise, if no adequate noise control is applied during image reconstruction. For image reconstruction with low-dose scans, sinogram restoration algorithms based on modeling the noise properties of measurement can produce an image with noise-induced artifact suppression, but they often suffer noticeable resolution loss. As an alternative method, the noise-reduction algorithms via edge-preserving image filtering can yield an image without noticeable resolution loss, but they often do not completely eliminate the noise-induced artifacts. With above observations, in this paper, we present a sinogram restoration induced non-local means (SR-NLM) image filtering algorithm to retain the CT image quality by fully considering the advantages of the sinogram restoration and image filtering algorithms in low-dose image reconstruction. Extensive experimental results show that the present SR-NLM algorithm outperforms the existing methods in terms of visual inspection, noise reduction, contrast-to-ratio measure, noise-resolution tradeoff and receiver operating characteristic (ROC) curves.
Keywords: CT, low-dose, sinogram restoration, non-local means, image filtering
1. Introduction
Radiation dose has raised significant concerns to patients and operators in modern x-ray computed tomography (CT) examinations and minimizing radiation dose is one of the major endeavors in CT fields [1, 2]. A simple and cost-effective means to perform a low-dose CT scan is to lower the milliampere-seconds (mAs) as low as reasonably achievable in data acquisition. However, the associated image quality with lower-mAs scans (or low-dose scans) will be unavoidably degraded due to the excessive data noise, if no adequate noise control is applied during image reconstruction [3, 4].
Up to now, for radiation dose reduction in CT examinations, various techniques including optimized scan protocols and auto-mAs control have been reported [5, 6], and many image reconstruction algorithms with noise-induced artifacts suppression have been explored [7–9]. Extensive studies have shown that for noisy data from low-dose scan, statistical iterative reconstruction (SIR) methods, by modeling the noise properties of the measurements and imposing adequate regularization within image reconstruction, can achieve a performance superior to other existing methods in terms of noise reduction and noise-resolution tradeoff [10–14]. However, a critical problem in SIR is the high computational burden due to the multiple re-projection and back-projection operations during image iterative reconstruction. To overcome this, restoring the ideal sinogram data from acquired noisy one and reconstructing the CT image from the estimated ideal sinogram data is an interesting alternative strategy with computational efficiency and noise-induced artifacts suppression [15–20]. One typical example is the penalized weighted least-squares (PWLS) algorithm [19, 21, 22], which can be derived from the Gaussian statistics of original sinogram data. However, the sinogram restoration algorithms often suffer noticeable resolution loss especially in the case of constant noise variance over all the sinogram data [21]. In an approach different from above mentioned SIR and sinogram restoration algorithms, many sophisticated linear/nonlinear noise-reduction algorithms via edge-preserving image filtering have also been investigated for low-dose CT image noise reduction without remarkable resolution loss [23–25]. Meanwhile, the noise in low-dose CT image is nonstationary and its distribution is usually unknown, which indicates that designing an edge-preserving image filter is a difficult task. Recently, a previous normal-dose scan induced non-local means (ndiNLM) image filter was proposed for addressing the problem of a conventional edge-preserving image filter by exploring the redundancy information from the reference image under the non-local means criteria [26].
In this study, inspired with the ndiNLM algorithm in low-dose CT image restoration [26], we present a sinogram restoration induced non-local means (SR-NLM) image filtering algorithm to retain the image quality by taking advantage of both the sinogram restoration and non-local means image filtering algorithms in low-dose CT image reconstruction. Specifically, for the present SR-NLM algorithm, the penalized-weighted least-squares (KL-PWLS) algorithm in the Karhunen-Loéve (KL) domain [19] was used for estimating the ideal sinogram from the low-dose noisy one and the non-local weights in weighted average operation were calculated according to the FBP image reconstructed from the KL-PWLS estimated sinogram. Qualitative and quantitative evaluations were carried out on the simulation and patient data in terms of cross profile, noise reduction, contrast-to-ratio measure, noise-resolution tradeoff and receiver operating characteristic (ROC) curves.
The remaining part of this paper is organized as follows. In section 2, the KL-PWLS algorithm for CT sinogram restoration, non-local means (NLM) and ndiNLM algorithms for image filtering are presented, respectively, and then the proposed SR-NLM image filtering algorithm is described in details. In section 3, experimental results are reported. Finally, the discussion and conclusion are given in sections 4 and 5, respectively.
2. Materials and Methods
2.1. Overview of the KL-PWLS algorithm for CT sinogram restoration
Wang, et al proposed the KL-PWLS algorithm to de-correlate data signals along nearby projection views for CT sinogram restoration by employing the KL transform [19]. In this study, the adapted KL transform with dimension 3×3 was first applied to account for the correlative information of continuous data sampling along nearby views of the sinogram data. Let y̑ and y denote the KL transformed components and the corresponding original sinogram data in the spatial domain. Then, in the KL domain, the PWLS criterion can be used to estimate the l-th KL component p̑l of ideal sinogram data from the l-th KL component y̑l of original sinogram data by minimizing the following objective function [19]:
| (1) |
where Σ̑l is the diagonal variance matrix and can be estimated from the variance of the original sinogram data yi,k at each bin i and view k [19]. The scalar β is a hyper-parameter, dl is the eigenvalue of the l-th KL basic vector, and Ȓ(p̑l) is the penalty term. Based on our previous analyses [27, 28], the original sinogram data y has a unique property which can be expressed by a relationship between the sample mean and variance:
| (2) |
where Ii0 is the incident x-ray intensity along the projection path i, is the variance of the electronic background noise, and ȳi,k is the sample mean of yi,k estimated by neighborhood averaging with a 3×3 window in this study. In modern CT systems, the parameters Ii0 and can be measured as part of the standard routine calibration operation [27]. In addition, the penalty term Ȓ(p̑l) can be defined as [19]
| (3) |
where Si indicates the two nearest neighbors of the i-th pixel in the KL domain along the 1-D bin direction. In this study, the parameter w̑(i, j) is equal to 1 for the two neighbors.
For minimizing the PWLS objective function (1), a modified iterative Gauss-Seidel (GS) update algorithm can be used in the KL domain [19,29]. After all the projection views have been treated by the KL-PWLS strategy, the CT image can be reconstructed by using the FBP algorithm from the estimated sinogram data.
2.2. Overview of the non-local means algorithm
The non-local means (NLM) algorithm was originally proposed by Buades et al [30] for image de-noising, which has been successfully applied to medical image restoration such as low-dose CT image restoration [26] and magnetic resonance image restoration [31]. Mathematically, the discrete version of their NLM algorithm can be expressed as follows: Let D be a discrete grid of pixels and μ={μi | i ∈ D} be a noisy image. The restored intensity NLM(μi) at the pixel i by the NLM algorithm is the weighted average of all the pixel intensities in the image μ and can be expressed as follows
| (4) |
where μj is the original image intensity at the pixel j and w(i, j) is the weight assigned to μj in the intensity restoration at the pixel i. The weight w(i, j) depends on the similarity between the pixels i and j, and satisfies the conditions of 0 ≤ w(i, j) ≤ 1 and Σj∈D w(i, j) =1, which can be expressed as follows
| (5) |
where Z(i) is a normalizing factor, i.e., . The terms Vi and Vj denote two local similarity neighborhoods (named patch-windows) centered at the pixels i and j, respectively. The term μ(Vi):={μk, k ∈ Vi} denotes the vector of neighborhood image intensity restricted in the patch-window Vi. The notation ||•||2,a denotes a Gaussian-weighted Euclidean distance metric between two similarity patch-windows, where a represents the standard deviation of Gaussian function. The parameter h is a smoothing factor controlling the decay of the exponential function in equation (5). In the implementation, to reduce the computational burden, the search-window is often confined to an appropriate non-local neighborhood Ni (< D) (termed the search-window) centered at the pixel i [26].
2.3. Overview of the ndiNLM algorithm
Since a normal-dose CT image scanned previously may be available in some clinical applications such as CT perfusion imaging and CT angiography, the previous normal-dose scan can provide a reference image to construct more reasonable non-local weights than those used in the original NLM algorithm for low-dose CT image restoration. With this observation, the ndiNLM algorithm was proposed recently by our group [26], which can be expressed as follows
| (6) |
| (7) |
where is the roughly registered previous normal-dose image aligned with the low-dose objective image μld. is the normalizing factor. The subsets Vi and Ṽj̃ denote two similarity patch-windows centered at the pixel i in the image μld and at the pixel j̃ in the reference image , respectively. Ñi represents the search-window centered at the pixel i in the reference image .
2.4. Description of the SR-NLM algorithm for low-dose CT image filtering
The proposed sinogram restoration induced non-local means (SR-NLM) algorithm adapts the ndiNLM algorithm to exploit more reasonable similarity information in the FBP image reconstructed from the KL-PWLS restored low-dose sinogram data, instead of the FBP image reconstructed from the original low-dose sinogram data. Specifically, the SR-NLM algorithm contains four major steps: (a) direct FBP image reconstruction ( ) from the original low-dose sinogram data; (b) sinogram restoration using the KL-PWLS algorithm and FBP image reconstruction ( ) from the KL-PWLS restored sinogram data; (c) non-local weights construction using the images and ; and (d) non-local weighted average using the calculated non-local means weights. In the following subsections, we describe the steps (c) and (d) in detail.
2.4.1 Non-local weights construction
Due to the suppressed noise and artifacts in the image , see figure 2(b), non-local weights can be better calculated from the image , instead of the low-dose image itself, to improve the non-local weighted average. Hence, similar to the form in equation (7), the proposed non-local weights can be written as:
| (8) |
where is the normalizing factor. The subsets Vi and V̂ĵ denote two similarity patch-windows centered at the pixel i in the image and at the pixel ĵ in the image , respectively. N̂i represents the search-window centered at the pixel i in the image .
Figure 2.
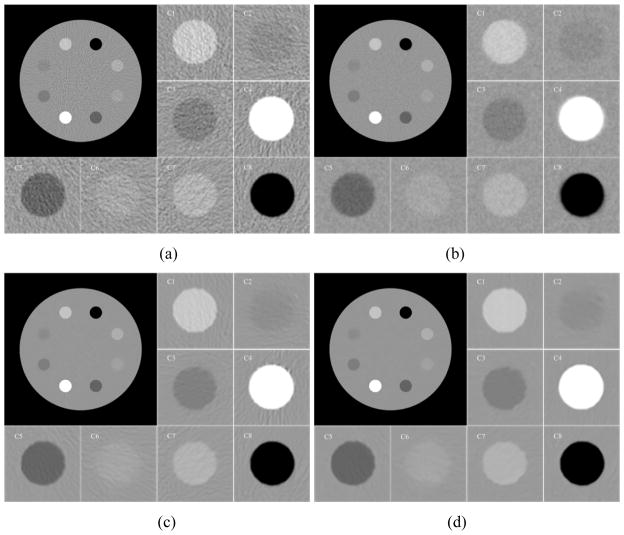
The clock phantom images reconstructed by different methods and eight zoomed regions indicated by the marks with C1 to C8 in figure 1(a). (a) the conventional FBP image with ramp filter reconstructed from the original sinogram data; (b) the standard FBP image reconstructed from the restored sinogram data by the KL-PWLS algorithm with β = 400 ; (c) the conventional FBP image restored by the original NLM algorithm with τ =5.6 ×10⁻³; and (d) the reconstructed FBP image restored by the present SR-NLM algorithm with β = 400, τ =1.4 ×10⁻³. All images are displayed with same window.
2.4.2 Non-local weighted average
After the construction of non-local weight ŵ(i, ĵ) according to (8), the present SR-NLM image filtering algorithm can be executed via non-local weighted average operation as follows
| (9) |
2.5. Parameter selections in the SR-NLM algorithm
For the present SR-NLM algorithm for low-dose CT image restoration, four parameters will be determined, i.e., the sizes of the search- and patch- windows, i.e., N̂i, Vi and V̂ĵ, the value of the smoothing parameter h, and the value of the penalty parameter β for the KL-PWLS sinogram restoration.
2.5.1 Selection of the search- and patch- windows
In this study, through extensive experiments by quantitative measures and visual inspection with comparison to the ideal phantom or normal-dose image, we found that a 21×21 search-window N̂i is adequate for effective noise-induced artifact suppression while retaining computational efficiency. In the implementation, the similarity of two patch-windows was measured by the conventional Euclidean distance and its effectiveness with a 5×5 similarity patch-window (Vi and V̂ĵ) has been fully evaluated in the experiments.
2.5.2 Selection of the smoothing parameter
Generally, the smoothing parameter h in equation (5) is a function of the standard deviation σ of the image noise, and h2 =ασ2 may be a good choice where α is a free scalar parameter. It is known that the noise distribution of the low-dose CT image is not stationary and usually unknown, and determining the standard deviation σ of the low-dose images is not a trivial task. Meanwhile, for the SR-NLM algorithm, because the noise and artifacts in the image have been significantly suppressed, as a reference image can be used to estimate the noise level of the image . Thus, the smoothing parameter h can be determined with h2 = 2τσ̄2 |N̂i| wherein σ̄ denotes the standard deviation of the image and is estimated by using the reference image . |N̂i| denotes the size of the search-window N̂i. The parameter τ is a scale factor.
2.5.3 Selection of the penalty parameter
For the KL-PWLS algorithm, the penalty parameter β in equation (1) controls the relative contributions of the two terms, i.e., the data-fidelity term and the penalty term. Generally, the penalty parameter β can be determined through an empirical, subjective, and time consuming trial and error process [32]. In this study, extensive experiments illustrated that the value of β within the range from 100 to 1000 was proper for both the KL-PWLS and SR-NLM algorithms.
Moreover, we adapted the NLM algorithm in equation (6) with a modification on its nonlocal weights, i.e., h2 = 2τσ2 |Ni|, to consider the size of the search-window centered at pixel i. The standard deviation σ of the image was estimated via a robust median estimator [33]. Through extensive experiments, we found that the sizes of search- and patch- windows with 21×21 and 5 ×5 were also proper for the original NLM algorithm. In addition, the scale factor τ for the NLM and SR-NLM algorithm was determined by a trial-and-error fashion for visually appealing results in comparison to the ideal phantom or normal-dose image.
3. Results
In this section, we evaluate the present SR-NLM algorithm for low-dose CT image filtering using both computer simulations and patient data.
3.1. Computer simulations
Computer simulations were performed on three digital phantoms as shown in figure 1, i.e., a modified 2D clock phantom [34], a slice of XCAT phantom [35] and a 2D modified Shepp-logan phantom [19]. The modified clock phantom consists of a circular water background with the diameter of 28.0 cm and eight circular inserts with varying contrast (C1: +30%, C2: −7%, C3: −15%, C4: +85%, C5: −30%, C6: +7%, C7: +15%, and C8: −85%). Each insert center with the diameter of 2.8 cm is located 9.0 cm from the center of the field of view (FOV). The slice of the XCAT phantom with human anatomies with a tumor lesion (contrast of +15%) was used for visual evaluation of anatomy structures. The modified Shepp-logan phantom, used for the receiver operating characteristic (ROC) study, contains a low-contrast small lesion as indicated by the arrow in figure 2(c). The density of the lesion is 1.5% above the background density and the radius of the lesion is 3.0 mm. We chose a geometry that was representative for a mono-energetic fan-beam CT scanner setup, and used a circular orbit to acquire 1160 views over 2π. The number of channels per view was 672 and the detector cell spacing was 1.407 mm. The detector arrays were on an arc concentric to the x-ray source with a distance of 1040.0 mm. The distance from the rotation center to the x-ray source was 570.0 mm. All the reconstructed images were represented by 512×512 array size with 0.625 mm pixel size. We obtained each projection datum along a ray through the phantom based on the known densities and intersection lengths of the ray with the geometric shapes of the objects in the phantom. Similar to the work of La Rivière et al [20], after the noise-free sinogram data ŷ were calculated, the noisy transmission measurement I were generated according to the statistical model of pre-logarithm projection data and can be described as follows
Figure 1.
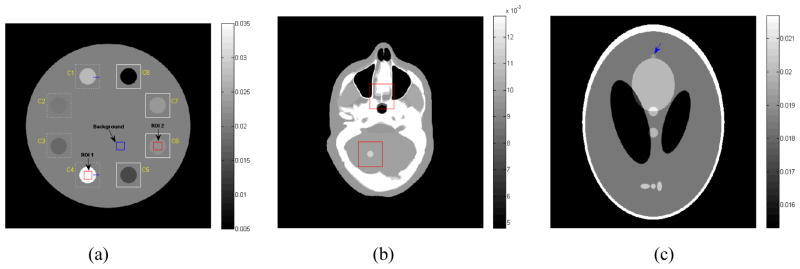
Three digital phantoms used for computer simulation studies. (a) the modified clock phantom contains eight inserts with varying contrast (C1: +30%, C2: −7%, C3: −15%, C4: +85%, C5: −30%, C6: +7%, C7: +15%, and C8: −85%). Eight ROIs marked by larger squares allow comparison of zoomed images. ROI 1, ROI 2 and background region indicated by small squares allow comparison of the contrast-to-noise ratio. The lines along the edges of the inserts (C1 and C4) allow comparison of the noise-resolution tradeoff; (b) the image of one slice of XCAT phantom with a lesion (contrast of +15%) as indicated by a square. Two ROIs marked by two squares allow visual inspection comparison of zoomed images; and (c) the modified Shepp-logan phantom with a low-contrast small lesion (contrast of +1.5%) as indicated by the blue arrow.
| (10) |
where I0 is the incident x-ray intensity and is the electronic background noise variance. In the simulations, I0 and for the clock phantom were set to be 5.0×10⁴ and 11.0, respectively; I0 and for the XCAT phantom were set to be 1.0×10⁵ and 11.0, respectively; and I0 and for the Shepp-logan phantom were set to be 2.0×10⁵ and 11.0, respectively. Finally, the noisy sinogram data y were calculated by performing the logarithm transformation on the transmission data I.
3.2. Clock phantom study
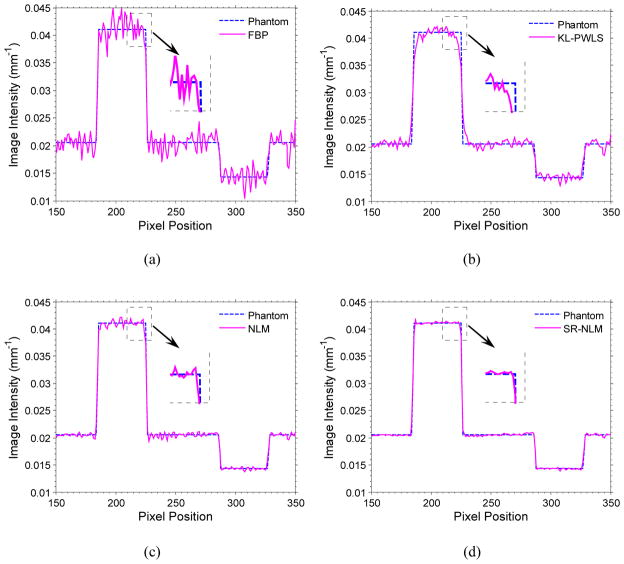
The images of the clock phantom reconstructed by four different methods are shown in figure 2. Figure 2(a) shows the conventional FBP image with ramp filter reconstructed from the original sinogram data. Serious noise and artifacts can be observed. Figure 2(b) shows the standard FBP image reconstructed from the KL-PWLS restored sinogram data with β = 400. We can see that the noise and artifacts have been significantly suppressed, but the resolution of image is noticeably lost as comparison with the FBP image in figure 2(a). Figure 2(c) shows the FBP image restored by the original NLM algorithm with τ =5.6×10⁻³. It can be seen that the artifacts still exist and some artifacts around the high-attenuated region (i.e., ROI C4) are slightly enhanced due to the nature of NLM algorithm for structure preserving. The result from the SR-NLM algorithm with β =400, τ =1.4×10⁻³ is shown in figure 2(d). We notice that the present SR-NLM algorithm achieves noticeable gains over the other two algorithms in terms of both artifacts suppression and edge preservation. To further illustrate the gains of the present SR-NLM algorithm, zoomed images of eight ROIs (region of interest), marked by the symbol Ci (i=1,2,…,8) in figure 1(a). Figure 3 draws the horizontal profiles through the center of both bone insert (C4) and the dark insert (C5) in the reconstructed images corresponding to figure 2. It can be observed that the present SR-NLM algorithm produces a closer profile to the true one especially in the edge region as indicated by an arrow in figure 3. The profile comparisons further reveal that higher low-contrast detestability and noticeable edge-preserving can be achieved by the present SR-NLM algorithm as comparison with other two algorithms.
Figure 3.
The horizontal profiles through the center of bone insert (C4) and the dark insert (C5) in the reconstructed clock phantom images corresponding to figure 2.
3.2.1 Noise reduction
In order to evaluate the performance of the present SR-NLM in a more quantitative manner, the peak signal-to-noise ratio (PSNR) and normalized mean square error (NMSE) merits were used in this study. They are defined as:
| (11) |
| (12) |
where μ(k) represents the intensity value at the pixel k in the image μ, μphantom (k) represents the intensity value at the pixel k in the ideal phantom image, and K denotes the number of image pixels. max(μphantom ) represents the maximum intensity value of the ideal phantom image. Table 1 shows the PSNRs and NMSEs of the reconstructed images by four different algorithms. It can be seen that the gains from the SR-NLM algorithm are noticeable compared to those from the other three algorithms in terms of the PSNR and NMSE measures. In other words, the SR-NLM algorithm can yield higher noise reduction than the other three algorithms in low-dose CT image filtering.
Table 1.
The PSNRs and NMSEs of the reconstructed images by four different algorithms.
| Methods | FBP | KL-PWLS | NLM | SR-NLM |
|---|---|---|---|---|
| PSNR (dB) | 29.63 | 35.48 | 37.85 | 38.88 |
| NMSE (1e-3) | 8.485 | 2.205 | 1.280 | 1.008 |
3.2.2 Contrast-to-noise ratio measure
Since a low-contrast region is of interest in the CT imaging, we selected two ROIs indicated by the boxes (named ROI 1 and ROI 2) in figure 1(a) for the calculation of the contrast-to-noise ratio (CNR). The CNR is defined as:
| (14) |
where μROI is the mean of the pixels inside the ROI, and μBG is the mean of the pixels in the background region. The terms σROI and σBG are the standard deviations of the pixel values inside the ROI and the background, respectively. In this study, the size of each ROI was set to be 20 × 20. Table 2 shows the CNRs of the reconstructed images by four different methods, respectively. It can be seen that for the high-contrast region of ROI 1, the difference of CNRs from four algorithms is not obvious, while for the low-contrast region of ROI 2, the gains from the SR-NLM algorithm are noticeable compared to the other three algorithms.
Table 2.
CNRs of the reconstructed images by different algorithms.
| Methods | FBP | KL-PWLS | NLM | SR-NLM |
|---|---|---|---|---|
| CNR (ROI 1) | 1.957 | 1.995 | 1.994 | 1.999 |
| CNR (ROI 2) | 0.786 | 1.463 | 1.776 | 1.918 |
3.2.3 Image-similarity metric
To assess the similarity between the reconstructed and original images, the universal quality index (UQI) was used in our study [36]. Given the aligned ROI within the reconstructed and original images, the associative mean, variance and covariance over the ROI can be calculated as:
| (15) |
| (16) |
where M denotes the number of pixels in the ROI. The UQI can be written as:
| (17) |
where μ and μphantom denote the reconstructed and ideal phantom images. The UQI value ranges between 0 and 1 and it more closer to 1 indicates the more similarity between the reconstructed and ideal phantom images. Figure 4 shows the UQI values of eight regions indicated by the squares with the symbol Ci (i=1,2,…,8) in figure 1(a) from the reconstructed images by four different algorithms. It can be seen that the gains from the SR-NLM algorithm are noticeable compared to those from the other three algorithms in terms of the UQI measure in eight regions.
Figure 4.
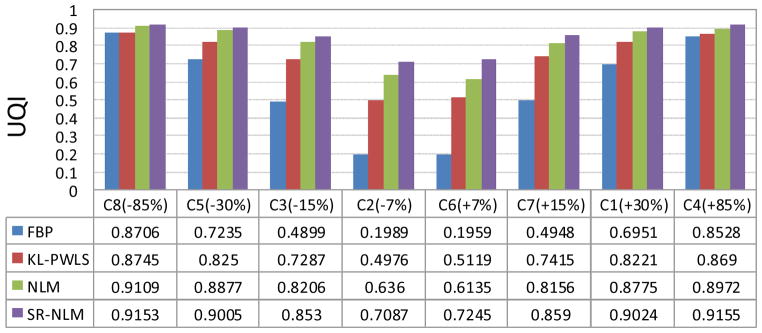
The UQIs of eight regions indicated by the squares with the symbol Ci (i=1,2,…,8) in figure 1(a) from the reconstructed images by four different algorithms.
3.2.4. Noise-resolution tradeoff
In order to evaluate the resolution of the reconstructed images, the noise-resolution tradeoff was studied in this study. In the calculation, the image resolution was analyzed by the edge spread function (ESF) along the edge of the inserts (C1 and C4) as indicated by two lines in figure 1(a). Assuming that the broadening kernel of the central horizontal profile at edge is a Gaussian function with standard deviation σb, the ESF can be described by an error function (erf) parameterized by σb. After fitting the horizontal profile to the error function, the parameter σb can be obtained. Finally, we used σb to calculate the full-width at half-maximum (FWHM), which reflects the resolution of reconstructed image. The noise level of reconstructed image was characterized by the standard deviation of the uniform regions with the size of 20 × 20 in the background near the inserts C1 and C4.
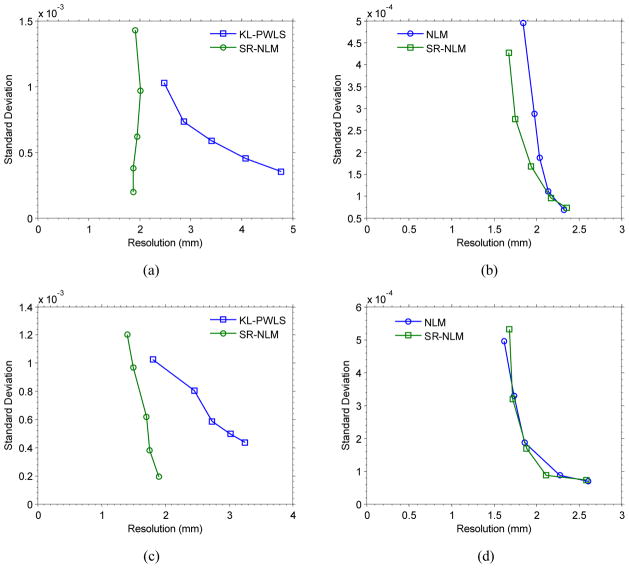
For the SR-NLM algorithm, through varying the penalty parameter β of the KL-PWLS algorithm from 100 to 1000 under the scalar parameter fixed with τ =1.5×10⁻³, we obtained the associated noise-resolution tradeoff curves as shown in figure 5(a) and (c). It can be seen that the resolution of the insert C4 from the SR-NLM algorithm is robust for the sinogram smoothed strength of the KL-PWLS algorithm (corresponding to the value of β), while the resolution of the insert C1 from the SR-NLM algorithm decreases as the sinogram smoothed strength of the KL-PWLS algorithm increases. In addition, after selecting a standard deviation level, the SR-NLM algorithm can achieve better image resolution than the KL-PWLS algorithm. The results further demonstrate that the performance of the SR-NLM algorithm does not heavily depend on the smoothing strength of the KL-PWLS algorithm in terms of noise-resolution measures. On the other hand, by varying the scalar parameter τ from 5 × 10⁻⁴ to 1×10⁻² for the SR-NLM algorithm under the penalty parameter fixed with β = 200, we obtained the associated noise-resolution curves as shown in figure 5(b) and (d). As a comparison, the noise-resolution curve of the NLM algorithm with the varying scalar parameter τ from 1×10⁻³ to 5 ×10⁻² was included. The results demonstrate that two algorithms have similar curve shape and the present SR-NLM algorithm yields a slightly better performance than the NLM algorithm in the high contrast region. But, it is worth to note that the resolutions of the inserts C1 and C4 from the SR-NLM algorithm are more sensitive to the parameter τ than the parameter β. In other words, the NLM and SR-NLM method have similar performance at the lower noise level in low-dose CT image restoration.
Figure 5.
The noise-resolution tradeoff curves. (a) the noise-resolution tradeoff curves of the insert C4 from the KL-PWLS and SR-NLM algorithms; (b) the noise-resolution tradeoff curves of the insert C4 from the NLM and SR-NLM algorithms; (c) the noise-resolution tradeoff curves of the insert C1 from the KL-PWLS and SR-NLM algorithms; and (d) the noise-resolution tradeoff curves of the insert C1 from the NLM and SR-NLM algorithms. The noise-resolution tradeoff curves shown in (a) and (c) were obtained by varying the penalty parameter β from 100 to 1000 and those shown in (b) and (d) were obtained by varying the scalar parameter τ from 5×10⁻⁴ to 1×10⁻².
3.3 XCAT phantom study
Figure 6(a) shows the FBP image with ramp filter reconstructed from the original low-dose sinogram data. Figure 6(b) shows the FBP image reconstructed from the KL-PWLS restored sinogram data with β = 200. It can be seen that the noise and artifacts have been significantly suppressed while the detailed structure information is noticeably lost in comparison with the ground-truth as shown in figure 1(b). Figure 6(c) shows the FBP image filtered by the original NLM algorithm with τ =1.3×10⁻². It can be seen that the artifacts are still noticeable due to the nature of NLM algorithm for structure preserving, which is consistent with the result of the clock phantom study. Figure 6(d) shows the result from the present SR-NLM algorithm with β = 200, τ =1.3×10⁻². We notice that the present SR-NLM algorithm can achieve significant gains relative to those of the other two algorithms in terms of both the noise-induced artifacts suppression and image edge preservation.
Figure 6.
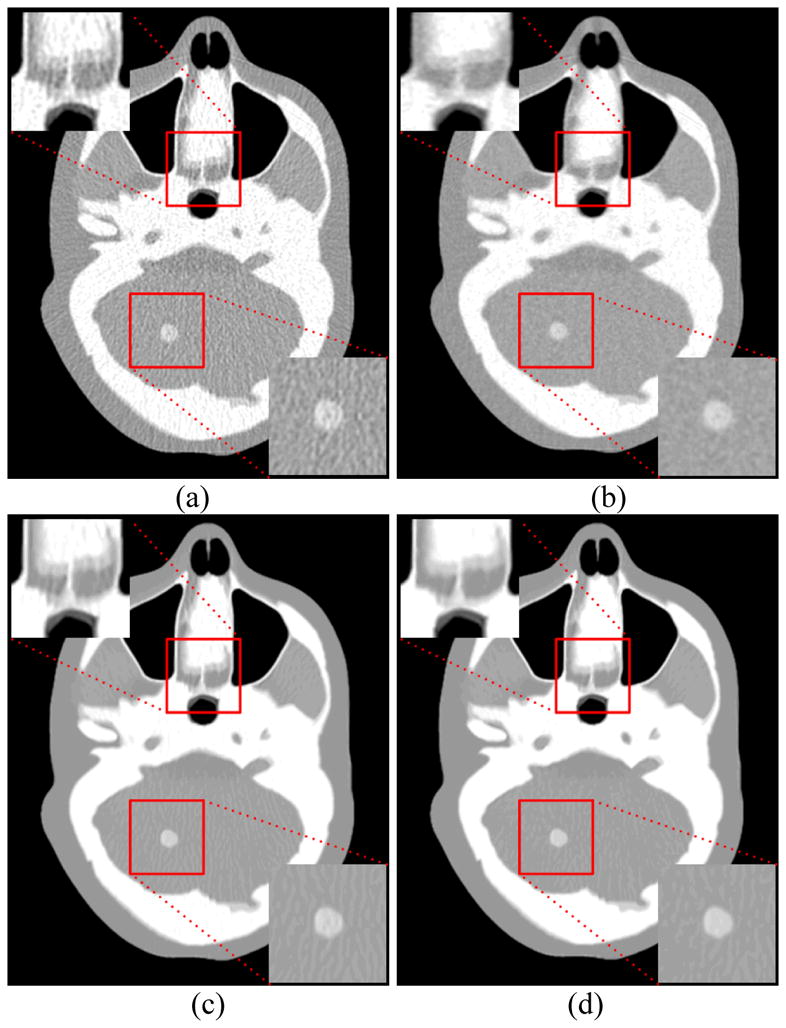
The XCAT phantom images reconstructed by different methods. (a) the conventional FBP with ramp filter reconstructed image from the original low-dose sinogram data; (b) the standard FBP reconstructed image from the restored low-dose sinogram data by the KL-PWLS algorithm with β = 200 ; (c) the conventional FBP image restored by the original NLM algorithm with τ =1.3 ×10⁻² ; and (d) the reconstructed FBP image restored by the present SR-NLM algorithm with β = 200, τ =1.3×10⁻². All images are displayed with same window. The ROIs indicated by the red squares are zoomed in to display the image details.
3.4 ROC study
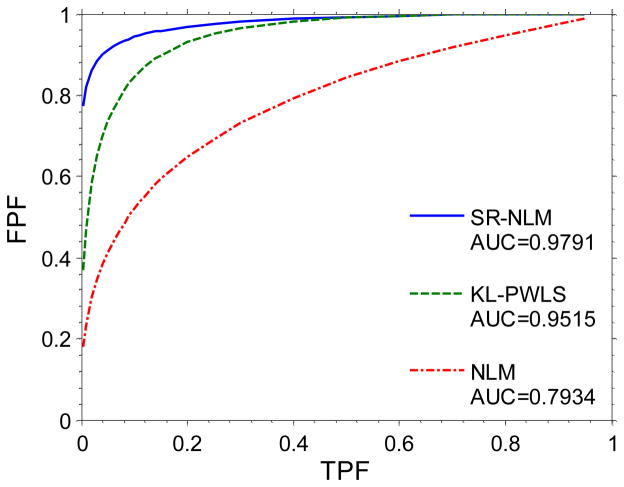
The ability of an observer to detect an abnormality is one generally accepted method for monitoring the performance of a medical imaging system or procedure. Using an observer study, a variety of pairs of true positive fraction (TPF) and false positive fraction (FPF) are calculated through changing the confidence threshold of an observer, and then a ROC curve can be fitted from the calculated TPF and FPF values [37,38]. In this study, to eliminate the intra human observer variation, the channelized Hotelling observer (CHO) [39] was adapted to generate scores for each reconstructed image by different methods. Specifically, the noise-free sinogram data of the modified Shepp-logan phantom with the lesion and the original phantom without the lesion were simulated, respectively. A total of 500 noisy sinogram data were generated from each noise-free sinogram by adding noise according to equation (10). The associative rating scores for each image were generated by the CHO algorithm [39], which were subsequently analyzed using the CLABROC code [38] resulting in four pairs of FPF and TPF for each reconstruction method. Finally, these four pairs were then fitted by a ROC curve using the binormal model. Figure 7 shows the ROC curves from three different methods. The area under the three curves is 0.9791 for the SR-NLM algorithm, 0.9515 for the KL-PWLS algorithm, and 0.7934 for the NLM algorithm. The one-tailed p-values between each pair of two algorithms are all less than 0.005, which indicates that the difference between these three methods is statistically significant.
Figure 7.
The ROC curves from three different methods.
3.5. Patient study
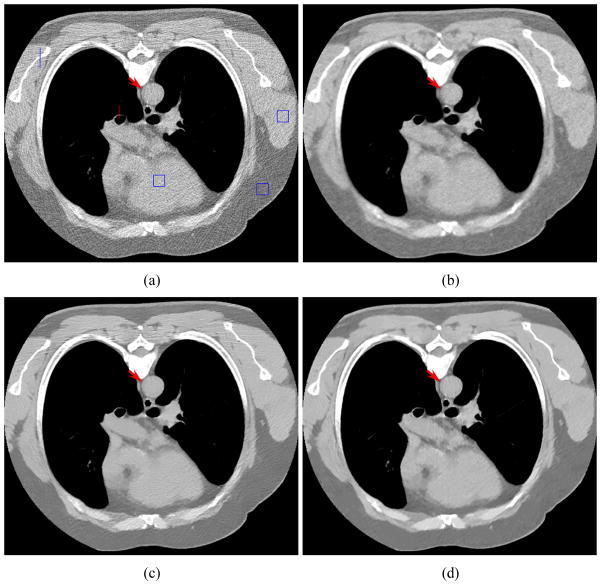
To further evaluate the effectiveness of the present SR-NLM algorithm for low-dose CT image filtering, a patient scan was scheduled with patient consent for a thorax CT study needed for medical reasons. All sinogram data were acquired with the 16-slice Siemens CT scanner in a cine mode with a protocol of 20 mAs and 120 kVp, which was just one-tenth of the routine x-ray exposure radiation scanned with a protocol of 200 mAs and 120 kVp.
Figure 8 shows the reconstructed images by four different algorithms. It can be seen that the results from the KL-PWLS, NLM, and SR-NLM algorithms have noticeable gains relative to those from the direct FBP algorithm as shown in figure 8(a) in terms of the noise and artifacts suppression. Similar to the results in the simulation studies, serious streak artifact have been successfully suppressed in the FBP image reconstructed from the KL-PWLS algorithm restored sinogram data, as shown in figure 8(b). But obvious artifacts exist in the FBP image restored by the NLM algorithm as shown in figure 8(c). As shown in figure 8(d), the present SR-NLM algorithm can not only successfully suppress the noise-induced artifacts but also achieve a noticeable image resolution preserving as comparison with the KL-PWLS and the NLM algorithms. To further illustrate the difference of all the reconstructed images, one vertical profile along a central line through a bony structure (as indicated by the line located at the left in figure 8(a)) and another vertical profile along a central line through a trachea and lung structure (as indicated by the line located at the center in figure 8(a)) are plotted in figure 9, respectively. The results demonstrate that the present SR-NLM algorithm can obtain slightly better edge-preserving than the KL-PWLS and NLM algorithms. In addition, to quantitatively evaluate image quality, we calculated the local signal-to-noise ratio (lSNR) of three local regions with the size of 20 × 20 as indicated by three squares in figure 8(a). The lSNR is defined as the ratio of the mean and standard deviation of the intensity in each local region. Table 3 lists the associative lSNRs of three local regions. It can be observed that the gains from the SR-NLM is remarkable compared to the other three methods in terms of the noise-induced artifacts suppression and the lSNR measurements.
Figure 8.
The patient study scanned with a protocol of 20 mAs and 120 kVp. (a) the conventional FBP image reconstructed with ramp filter from the original sinogram data; (b) the standard FBP image reconstructed from the restored sinogram data by the KL-PWLS algorithm with β = 1000 ; (c) the conventional FBP image restored by the original NLM algorithm with τ =7.7 ×10⁻⁴; and (d) the FBP image from by the present SR-NLM algorithm with β =1000, τ =1.7 ×10⁻³. Three ROIs indicated by squares allows comparison of the local signal-to-noise ratio. The line through a bony structure and the red line through a trachea and lung structure allow comparison of profiles. All images are displayed in the same window.
Figure 9.
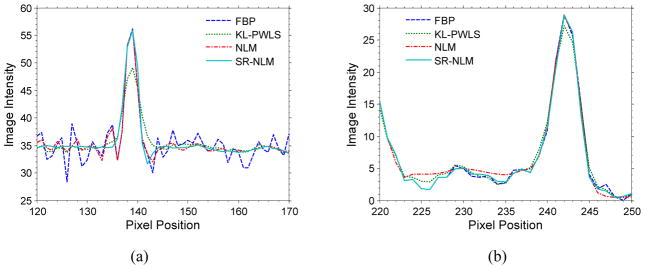
The vertical profiles (a) along a central line through a bony structure as indicated by the line located at the left in figure 8(a) and vertical profiles (b) along a central line through a trachea and lung structure as indicated by the line located at the center in figure 8(a).
Table 3.
The lSNRs of three local regions as indicated by three squares in figure 8(a).
| Methods | FBP | KL-PWLS | NLM | SR-NLM |
|---|---|---|---|---|
| lSNR (ROI 1) | 11.72 | 123.25 | 474.24 | 690.49 |
| lSNR (ROI 2) | 8.77 | 103.11 | 488.14 | 709.49 |
| lSNR (ROI 3) | 8.75 | 77.98 | 175.69 | 636.02 |
4. Discussion
The original NLM algorithm is performed as a non-local weighted average through the intensity similarity calculation between the patches within the neighborhood of the concerned pixel and does not depend on the spatial proximity to the concerned pixel. Conceptually, the averaging weights can be interpreted as a probability distribution with normalization to unity and is always positive. The act of optimizing the non-local weights to remove noise is crucial for the NLM algorithm. Up to now, several methods have been proposed with aiming at yielding optimized non-local weights [26,31,40]. In this paper, we also provided an alternative strategy, named the SR-NLM algorithm, to design the non-local weights for low-dose CT restoration based on our previous work [26]. The experimental results in section 3 have shown that the gains of the SR-NLM algorithm are remarkable compared to the original NLM algorithm in terms of noise-induced artifacts reduction and noise-resolution curve measure.
The non-local weights of the SR-NLM algorithm were calculated by incorporating the FBP image reconstructed from the KL-PWLS restored sinogram data. The gains of the KL-PWLS with reducd noise-induced streak artifacts were also evaluated and validated for the SR-NLM algorithm in section 3. In the implementation, other projection data restoration algorithms with reducing noise-induced streak artifacts can also be adapted into the SR-NLM algorithm, such as the ATM filtering [3] in the sinogram domain and the Poisson-likelihood based algorithms [20, 41] in the transmission domain.
A critical problem in our approach is determining the parameters. Usually, these parameters were determined through an empirical, subjective, and time consuming trial and error process [26,32]. In this work, as described in section 2.5, we also determined the parameters empirically for the SR-NLM algorithm in a trial-and-error fashion by quantitative measure and visual inspection with comparison to the ideal phantom or normal-dose image. In the practical applications, all the parameters should be determined adaptively, but this is a really difficult task. As suggested by a reviewer, for the present SR-NLM algorithm, exploring some kind of methodology including a heuristic one for the parameters selection would be a useful and interesting topic.
5. Conclusion
In this study, we proposed a sinogram restoration induced non-local means (SR-NLM) image filtering algorithm for CT image restoration with low-mAs scans based on our previous studies [19,25,26,28,29]. The SR-NLM algorithm takes the advantage of the fact that the KL-PWLS algorithm can yield an image with noise-induced artifacts suppression and the NLM algorithm can obtain an image with resolution preservation. The experimental results as presented in section 3 have demonstrated that the gains from the present SR-NLM algorithm are remarkable compared to the original NLM and KL-PWLS algorithms in terms of quantitative measurements and visual inspection.
Among future research directions, we think it could be worth exploring strategies to optimize the parameters in different applications. We also plan to work on possible extensions of the present method to different sinogram restoration strategies such as the ATM filtering [3] and the Poisson-likelihood based algorithms [20, 41] in the transmission domain.
Acknowledgments
This work was partially supported by the National Natural Science Foundation of China under grand (No. 81000613, No. 81101046), the National Key Technology Research and Development Program of the Ministry of Science and Technology of China under grant (No. 2011BAI12B03), the Science and Technology Program of Guangdong Province of China under grant (No. 2011A030300005), and the 973 Program of China under grant (No. 2010CB732503). Z. Liang and J. Ma also were partially supported by the NIH/NCI under Grant #CA143111 and Grant #CA082402. The authors also thank the anonymous reviewers for their extremely useful suggestions for improving the quality of the paper. The editing of this paper by Dr. Gene Gindi shall be acknowledged.
Footnotes
Conflicts of interest statement
No conflicts of interest were declared by the authors.
References
- 1.Brenner DJ, Hall EJ. Computed tomography--an increasing source of radiation exposure. N Engl J Med. 2007;357:2277–84. doi: 10.1056/NEJMra072149. [DOI] [PubMed] [Google Scholar]
- 2.Einstein AJ, Henzlova MJ, Rajagopalan S. Estimating risk of cancer associated with radiation exposure from 64-slice computed tomography coronary angiography. JAMA. 2007;298:317–23. doi: 10.1001/jama.298.3.317. [DOI] [PubMed] [Google Scholar]
- 3.Hsieh J. Adaptive streak artifact reduction in computed tomography resulting from excessive x-ray photon noise. Med Phys. 1998;25:2139–47. doi: 10.1118/1.598410. [DOI] [PubMed] [Google Scholar]
- 4.Li T, Li X, Wang J, Wen J, Lu H, Hsieh J, et al. Nonlinear sinogram smoothing for low-dose x-ray ct. IEEE Trans Nucl Sci. 2004;51:2505–13. [Google Scholar]
- 5.Kalender WA, Wolf H, Suess C, Gies M, Greess H, Bautz WA. Dose reduction in CT by online tube current control: principles and validation on phantoms and cadavers. European Radiology. 1999;9:323–328. doi: 10.1007/s003300050674. [DOI] [PubMed] [Google Scholar]
- 6.McCollough CH, Bruesewitz MR, Kofler JM. CT dose reduction and dose management tools: Overview of available options. Radiographics. 2006;26:503–512. doi: 10.1148/rg.262055138. [DOI] [PubMed] [Google Scholar]
- 7.McCollough CH, Bruesewitz MR, Kofler JM. CT dose reduction and dose management tools: overview of available options. Radio-graphics. 2006;26:503–12. doi: 10.1148/rg.262055138. [DOI] [PubMed] [Google Scholar]
- 8.Kalra MK, Maher MM, Toth TL, Hamberg LM, Blake MA, Shepard JA, et al. Strategies for CT radiation dose optimization. Radiology. 2004;230:619–28. doi: 10.1148/radiol.2303021726. [DOI] [PubMed] [Google Scholar]
- 9.Yu L. Radiation dose reduction in computed tomography: techniques and future perspective. Imaging Med. 2009;1:65–84. doi: 10.2217/iim.09.5. [DOI] [PMC free article] [PubMed] [Google Scholar]
- 10.Elbakri LA, Fessler JA. Efficient and accurate likelihood for iterative image reconstruction in x-ray computed tomography. Proc SPIE. 2003;5032:1839–50. [Google Scholar]
- 11.Wang J, Li T, Xing L. Iterative image reconstruction for CBCT using edge-preserving prior. Med Phys. 2009;36:252–60. doi: 10.1118/1.3036112. [DOI] [PMC free article] [PubMed] [Google Scholar]
- 12.Huang J, Ma J, Liu N, Zhang H, Bian Z, Feng Y, et al. Sparse angular CT reconstruction using non-local means based iterative-correction POCS. Comput Biol Med. 2011;41:195–205. doi: 10.1016/j.compbiomed.2011.01.009. [DOI] [PubMed] [Google Scholar]
- 13.Ma J, Zhang H, Gao Y, Huang J, Liang Z, Feng Q, et al. Iterative image reconstruction for cerebral perfusion CT using a pre-contrast scan induced edge-preserving prior. Phys Med Biol. 2012;57:7519–42. doi: 10.1088/0031-9155/57/22/7519. [DOI] [PMC free article] [PubMed] [Google Scholar]
- 14.Liu Y, Ma J, Fan Y, Liang Z. Adaptive-weighted total variation minimization for sparse data toward low-dose x-ray computed tomography image reconstruction. Phys Med Biol. 2012;57:7923–56. doi: 10.1088/0031-9155/57/23/7923. [DOI] [PMC free article] [PubMed] [Google Scholar]
- 15.Kak AC, Slaney M. Principles of computerized tomographic imaging. 2. New York: IEEE Press; 1988. [Google Scholar]
- 16.Kachelriess M, Watzke O, Kalender WA. Generalized multi-dimensional adaptive filtering for conventional and spiral single-slice, multi-slice, and cone-beam CT. Med Phys. 2001;28:475–90. doi: 10.1118/1.1358303. [DOI] [PubMed] [Google Scholar]
- 17.Manduca A, Yu L, Trzasko JD, Khaylova N, Kofler JM, McCollough CM, et al. Projection space denoising with bilateral filtering and CT noise modeling for dose reduction in CT. Med Phys. 2009;36:4911–19. doi: 10.1118/1.3232004. [DOI] [PMC free article] [PubMed] [Google Scholar]
- 18.Demirkaya O. Reduction of noise and image artifacts in computed tomography by nonlinear filtration of the projection images. Proc SPIE. 2001;4322:917–23. [Google Scholar]
- 19.Wang J, Li T, Lu H, Liang Z. Penalized weighted least-squares approach to sinogram noise reduction and image reconstruction for low-dose X-ray computed tomography. IEEE Trans Med Imaging. 2006;25:1272–83. doi: 10.1109/42.896783. [DOI] [PMC free article] [PubMed] [Google Scholar]
- 20.La Rivière PJ, Bian J, Vargas PA. Penalized-likelihood sinogram restoration for computed tomography. IEEE Trans Med Imaging. 2006;25:1022–36. doi: 10.1109/tmi.2006.875429. [DOI] [PubMed] [Google Scholar]
- 21.Wang J, Lu H, Liang Z, Eremina D, Zhang G, Wang S, et al. An experimental study on the noise properties of x-ray CT sinogram data in radon space. Phys Med Biol. 2008;53:3327–41. doi: 10.1088/0031-9155/53/12/018. [DOI] [PMC free article] [PubMed] [Google Scholar]
- 22.Wang J, Li T, Liang Z, Xing L. Dose reduction for kilovotage cone-beam computed tomography in radiation therapy. Phys Med Biol. 2008;53:2897–909. doi: 10.1088/0031-9155/53/11/009. [DOI] [PubMed] [Google Scholar]
- 23.Schaap M, Schilham AM, Zuiderveld KJ, Prokop M, Vonken EJ, Niessen WJ. Fast noise reduction in computed tomography for improved 3-d visualization. IEEE Trans Med Imaging. 2008;27:1120–29. doi: 10.1109/TMI.2008.918322. [DOI] [PubMed] [Google Scholar]
- 24.Borsdorf A, Raupach R, Flohr T, Hornegger J. Wavelet based noise reduction in ct-images using correlation analysis. IEEE Trans Med Imaging. 2008;27:1685–1703. doi: 10.1109/TMI.2008.923983. [DOI] [PubMed] [Google Scholar]
- 25.Huang J, Ma J, Liu N, Feng Q, Chen W. Projection data restoration guided non-local means for low-dose computed tomography reconstruction. Proc IEEE International Symposium on Biomedical Imaging: From Nano to Macro (ISBI) 2011:1167–1170. [Google Scholar]
- 26.Ma J, Huang J, Feng Q, Zhang H, Lu H, Liang Z, et al. Low-dose computed tomography image restoration using previous normal-dose scan. Med Phys. 2011;38:5714–31. doi: 10.1118/1.3638125. [DOI] [PMC free article] [PubMed] [Google Scholar]
- 27.Ma J, Liang Z, Fan Y, Liu Y, Huang J, Chen W, et al. Variance estimation of x-ray CT sinogram in radon domain. Proc SPIE. 2012;8313:83132G. [Google Scholar]
- 28.Ma J, Liang Z, Fan Y, Liu Y, Huang J, Chen W, et al. Variance analysis of x-ray CT sinograms in the presence of electronic noise background. Med Phys. 2012;39:4051–65. doi: 10.1118/1.4722751. [DOI] [PMC free article] [PubMed] [Google Scholar]
- 29.Sauer K, Bouman C. A local update strategy for iterative reconstruction from projections. IEEE Trans Signal Process. 1993;41:534–48. [Google Scholar]
- 30.Buades A, Coll B, Morel MJ. A review of image denoising algorithms, with a new one. Multiscale Model Simul. 2005;4:490–530. [Google Scholar]
- 31.Coupe P, Yger P, Prima S, Hellier P, Kervrann C, Barillot C. An optimized blockwise nonlocal means denoising filter for 3-D magnetic resonance images. IEEE Trans Med Imaging. 2008;27:425–41. doi: 10.1109/TMI.2007.906087. [DOI] [PMC free article] [PubMed] [Google Scholar]
- 32.Wang J, Guan H, Solberg T. Inverse determination of the penalty parameter in penalized weighted least-squares algorithm for noise reduction of low-dose CBCT. Medical Physics. 2011;38:4066–72. doi: 10.1118/1.3600696. [DOI] [PubMed] [Google Scholar]
- 33.Donoho DL, Johnstone IM. Ideal spatial adaptation via wavelet shrinkage. Biometrika. 1994;81:425–55. [Google Scholar]
- 34.Evans JD, Politte DG, Whiting BR, O’Sullivan JA, Williamson JF. Noise-resolution tradeoffs in x-ray CT imaging: A comparison of penalized alternating. Med Phys. 2011;38:1444–58. doi: 10.1118/1.3549757. [DOI] [PMC free article] [PubMed] [Google Scholar]
- 35.Segars WP, Sturgeon G, Mendonca S, Grimes J, Tsui BM. 4D XCAT phantom for multimodality imaging research. Med Phys. 2010;37:4902–15. doi: 10.1118/1.3480985. [DOI] [PMC free article] [PubMed] [Google Scholar]
- 36.Wang Z, Bovik AC. A universal image quality index. IEEE Signal Processing Letters. 2002;9:81–84. [Google Scholar]
- 37.Fawcett T. An introduction to ROC analysis. Pattern Recognition Letters. 2006;27:861–874. [Google Scholar]
- 38.Metz CE. ROC methodology in radiological imaging. Invest Radiol. 1986;21:720–33. doi: 10.1097/00004424-198609000-00009. [DOI] [PubMed] [Google Scholar]
- 39.Myers KJ, Barrett HH. Addition of a channel mechanism to the ideal-observer model. J Opt Soc Amer. 1987;4:2447–57. doi: 10.1364/josaa.4.002447. [DOI] [PubMed] [Google Scholar]
- 40.Gal Y, Mehnert AJ, Bradley AP, McMahon K, Kennedy D, Crozier S. Denoising of dynamic contrast-enhanced MR images using dynamic nonlocal means. IEEE Trans Med Imaging. 2010;29:302–310. doi: 10.1109/TMI.2009.2026575. [DOI] [PubMed] [Google Scholar]
- 41.La Rivière PJ, Billmire DM. Reduction of noise-induced streak artifacts in X-ray computed tomography through spline-based penalized-likelihood sinogram smoothing. IEEE Trans Med Imaging. 2005;24:105–11. doi: 10.1109/tmi.2004.838324. [DOI] [PubMed] [Google Scholar]


