Figure 4.

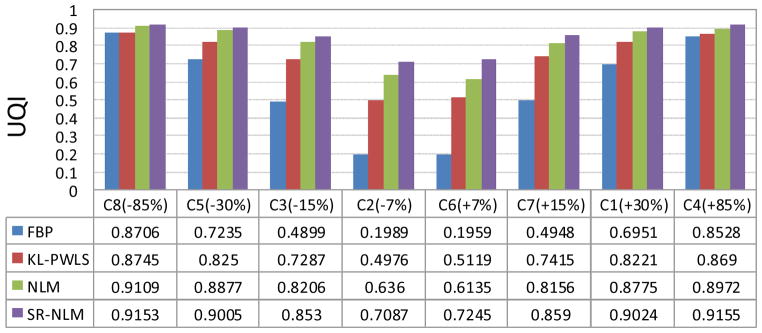
The UQIs of eight regions indicated by the squares with the symbol Ci (i=1,2,…,8) in figure 1(a) from the reconstructed images by four different algorithms.

The UQIs of eight regions indicated by the squares with the symbol Ci (i=1,2,…,8) in figure 1(a) from the reconstructed images by four different algorithms.