
Figure 3.
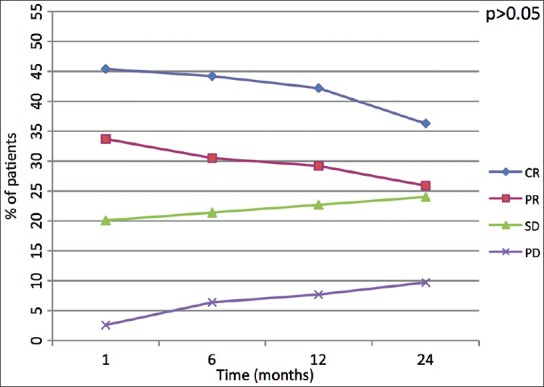
Linear diagram shows behavior of target lesion response among the four groups of response (CR: Complete response, PR: Partial response, SD: Stable disease, PD: Progressive disease) over the time. The P value indicates if the shift of values after 24 months is either statistically signifi cant (<0.05) or not (>0.05)