
Figure 3.
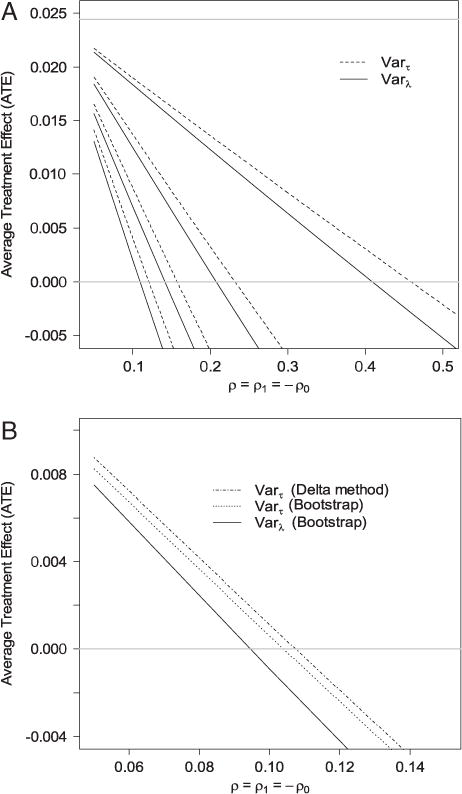
(A) Estimates of the lower bound of the effect of abciximab on cost under different combinations of ρ = ρ1=−ρ0 and τ. Dashed lines are the estimates of the ATE based on Varτ(S*|S) (Eq. 11) and solid lines are the ATE based on Varλ(S*|S) (Eq. 12). The four dashed lines correspond to (from top to bottom) τ = 0.1, 0.2, 0.3, and 0.4. The four solid lines correspond to (from top to bottom) λ(0.1) = 0.0063, λ(0.2) = 0.0245, λ(0.3) = 0.0526, and λ(0.4)= 0.0881. The horizontal gray line on the top is the estimated ATE assuming no uncontrolled confounding. (B) The lower limit of the one-sided 90% confidence interval of the lower bound of the intervention effect for τ = 0.3 for different values of ρ = ρ1=− ρ0.