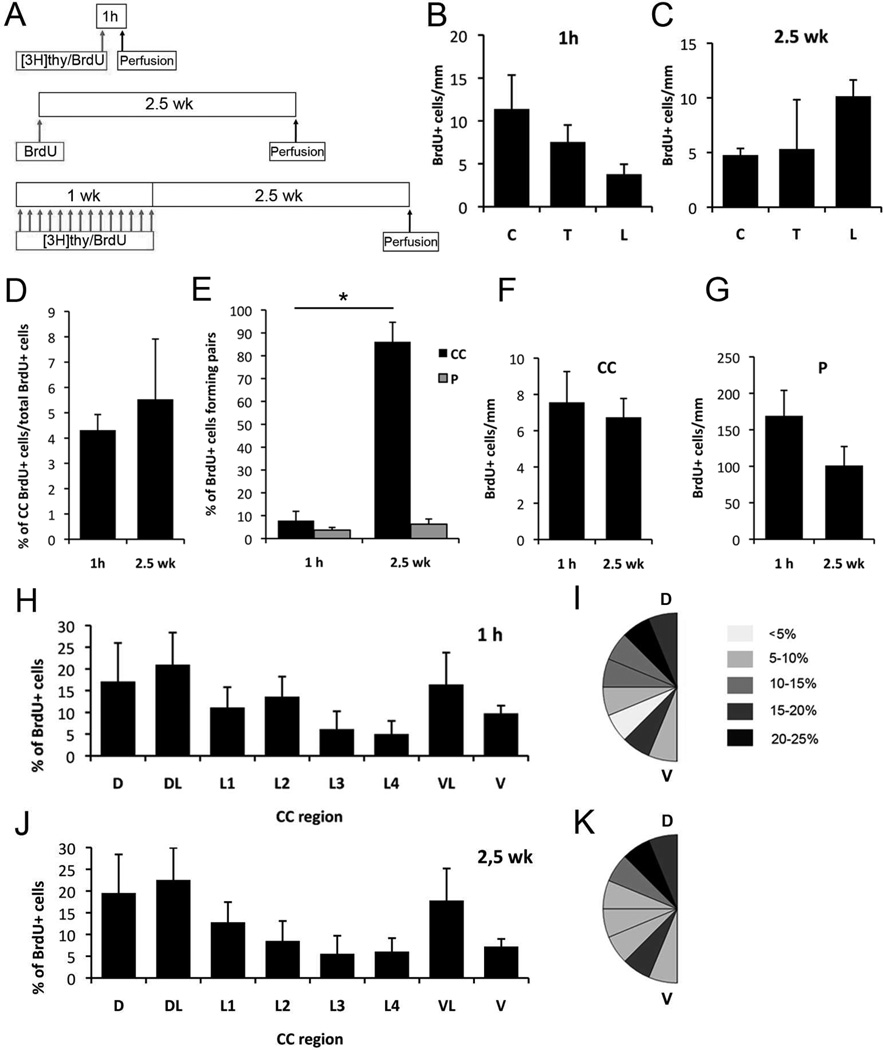
Figure 6. Proliferation along the spinal cord.
A) BrdU and [3H]thymidine injection protocols. B–C) Proliferation in the central canal and in the parenchyma does not significantly vary along cervical, thoracic and lumbar regions, 1 hour (1 h) as well as 2.5 weeks (2.5 wk) after BrdU injection. D) In the spinal cord, the percentage of labeled cells in the canal from the total number of spinal cord labeled cells did not vary between the two studied protocols. E) More than 80% of labeled cells after 2.5 weeks are forming pairs in the central canal. F–G) In the spinal cord central canal and parenchyma, no differences were observed between labeled cell numbers after 1 hour or 2.5 weeks. H–K) Distribution of BrdU+ cells along the dorsoventral axis in the central canal 1 hour (H–I) and 2.5 weeks (J–K) after BrdU injection. Labeled cells concentrated in dorsal and ventral regions, and fewer cells were found in the lateral canal walls. This distribution was very similar in both groups of study. A–G) C, cervical; T, thoracic; L, lumbar; CC, central canal; P, parenchyma. H–K) CC, central canal; D, dorsal; DL, dorsolateral; L1-L4, lateral; VL, ventrolateral; V, ventral. Error bars show SEM.

