
Figure 5. Naïve Infarct Size vs. Occlusion Time in Four Strains.
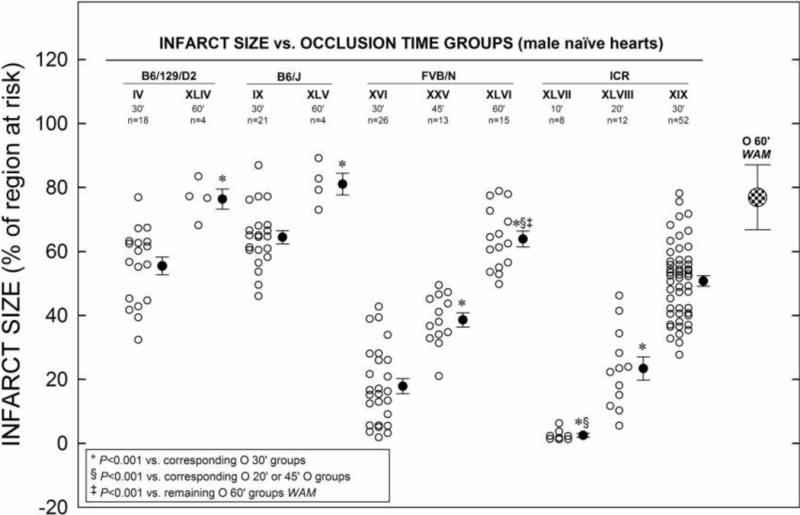
Myocardial infarct size in non-preconditioned (naïve) hearts from four different strains of mice in groups XLIV–XLIII (including young adult groups IV, IX, XVI, XIX and XXVI) that received 10–60-min O followed by 24 h R (Fig. 1 D). Infarct size is expressed as percentage of region at risk. Individual mice (○) and Mean ± SEM (●), for respective groups (n, number of mice); weighted arithmetic mean (WAM, 76.9 ± 10.2% of region at risk) for all infarcted with 60-min O naïve groups (checkered circle).