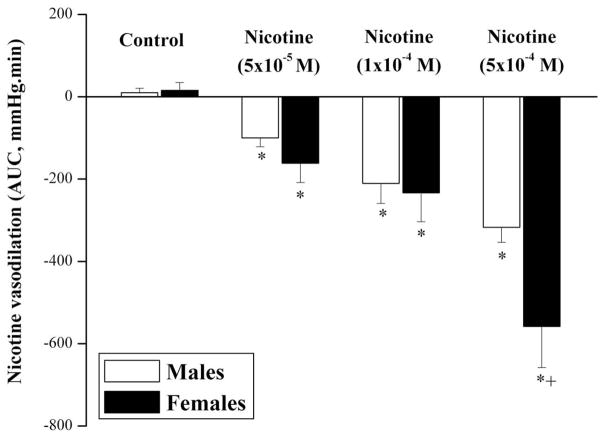
Fig. 2.
Bar graphs showing the area under the curve (mmHg.min) of the vasodilatory effect of nicotine (5×10⁻⁵, 1×10⁻⁴, or 5×10⁻⁴ M) in phenylephrine (10–20 μM)-preconstricted isolated perfused kidneys obtained from male and proestrus female rats. *P<0.05 vs. corresponding control values, +P<0.05 vs. corresponding male values.

