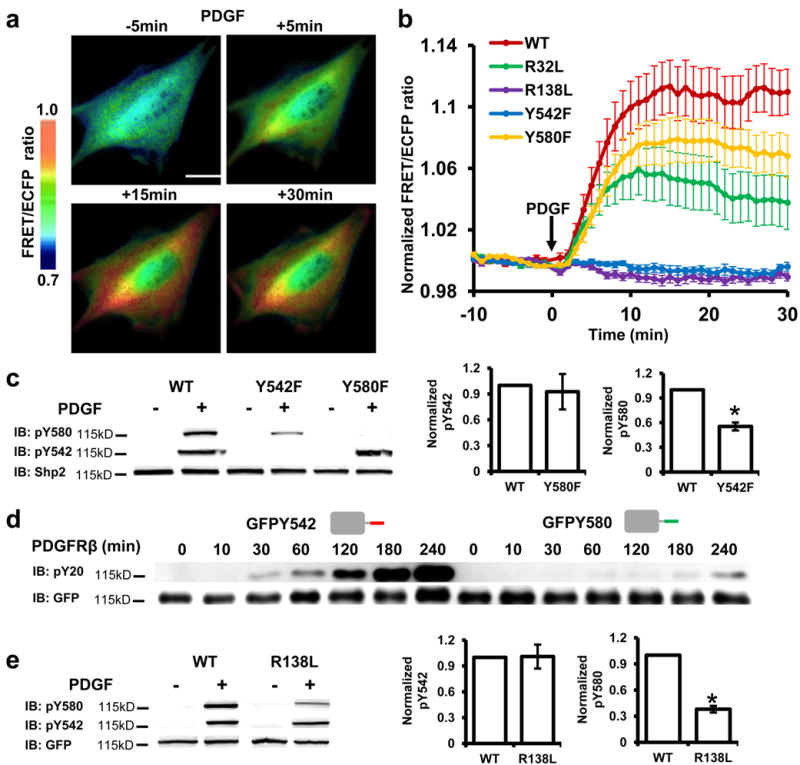
Figure 3. cis-Interactions and their regulation within the Shp2 reporters in MEFs.

(a) The ratiometric images of a MEF cell transfected with the WT reporter before and after PDGF stimulation for various periods of time. Scare bar = 10 μm. (b) The ratio time courses (mean ± S.E.M, n=18, 17, 15, 15 and 11) of MEFs expressing the WT reporter or its mutants. (c) The phosphorylation of WT and tyrosine mutant reporters in MEFs before and after 5 min PDGF stimulation. Bar graphs represent the mean ± S.E.M. *, P < 0.05. (Student’s t-test, n=3, refer to Supplementary Figure S6b for the whole blots). (d) The tyrosine phosphorylation levels of the purified GFPY542 (1 µM) or GFPY580 (1 µM) reporter before and after 10 nM PDGFRβ incubation for indicated time periods. (e) The phosphorylation of WT and C-SH2 mutant reporters in MEFs before and after 5 min PDGF stimulation. Bar graphs represent the mean ± S.E.M. *, P < 0.05 (Student’s t-test, n=3). Whole-cell lysate was used for panels (c) and (e).
