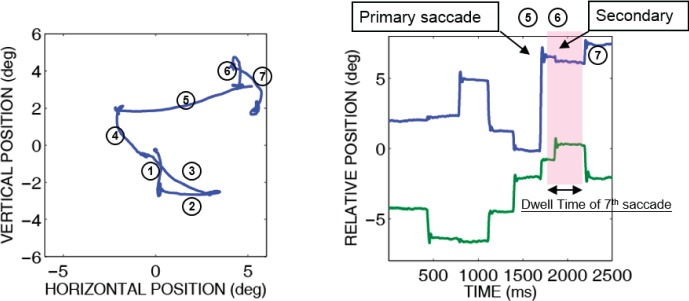
Figure 3.
Sample eye trace for a single trial shown as eye positions (left) and horizontal (top) and vertical (bottom) eye positions over time (right). Saccades are numbered in both graphs. The number on both graphs represents the order of saccades in the search sequence. The eye trace shows an example of primary and secondary saccades. The shaded area shows the dwell time between successive primary saccades.

