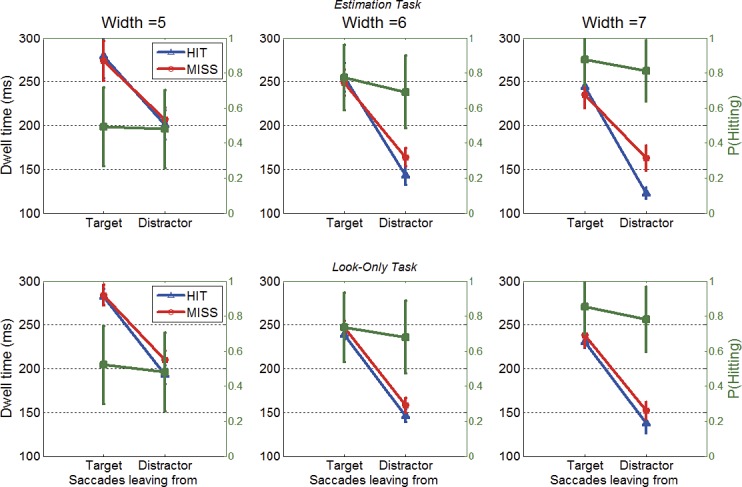
Figure 6.

Dwell time as a function of saccade starting location, target or distractor, and landing position (HIT/MISS) in the estimation task (top row) and in the look-only task (bottom row). Data were only for longer trial duration (2 s). Blue lines represent the dwells of saccades that hit a target, and red lines represent the dwells of saccades that missed. The superimposed green lines represent the probability of hitting a target as a function of saccade starting location (green axis on the right hand side). Bars show ± SE; otherwise, SEs are smaller than the plotting symbols. The first saccade in the sequence was not included because the first saccade left from initial fixation.
