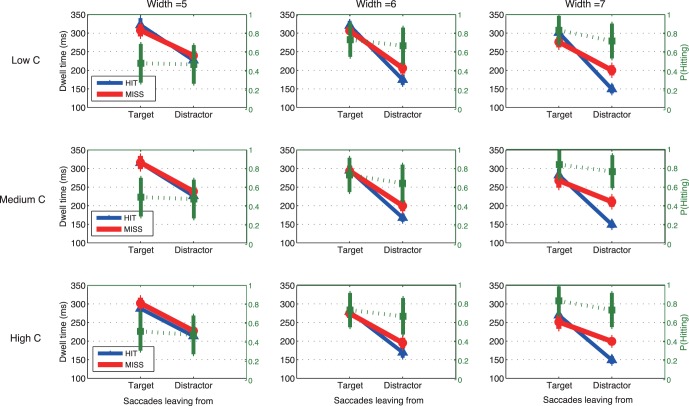
Figure 10.
Dwell time as a function of saccade starting locations (target or distractor) and landing positions (HIT/MISS) in the estimation task of Experiment 2. Blue lines represent the dwells of saccades that hit a target, and red lines represent the dwells of saccades that missed. The superimposed green lines represent the probability of hitting a target as a function of saccade starting locations (green axis on the right-hand side). Bars show ± SE; otherwise, SEs are smaller than the plotting symbols. The first saccade in the sequence was not included because the first saccade left from initial fixation. Each row represents one level of stimulus contrast (low, medium, or high contrast).

