Fig. 1.

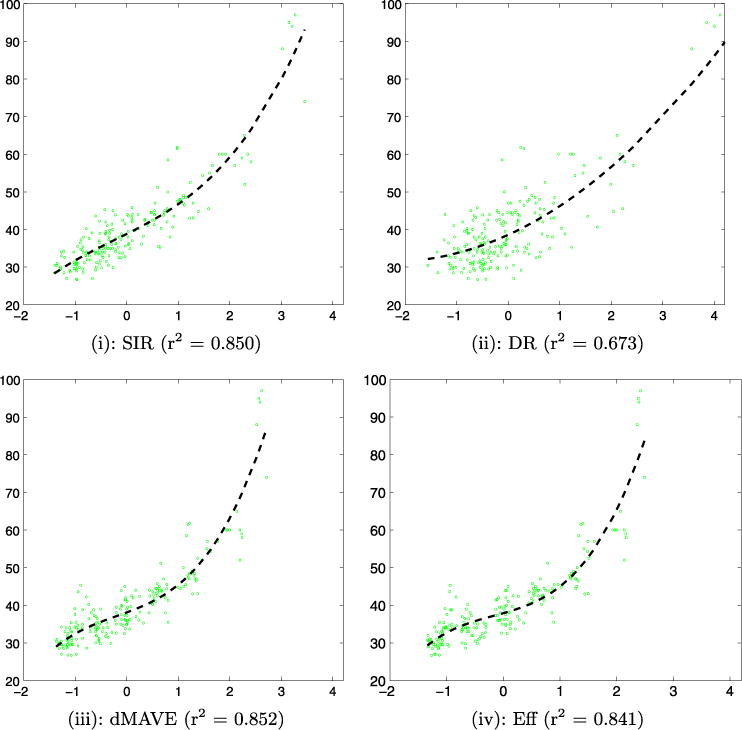
The scatter plot of Y versus , with obtained from SIR, DR, dMAVE and Eff, respectively. The fitted cubic regression curves (−) and the adjusted r2 values are shown.

The scatter plot of Y versus , with obtained from SIR, DR, dMAVE and Eff, respectively. The fitted cubic regression curves (−) and the adjusted r2 values are shown.