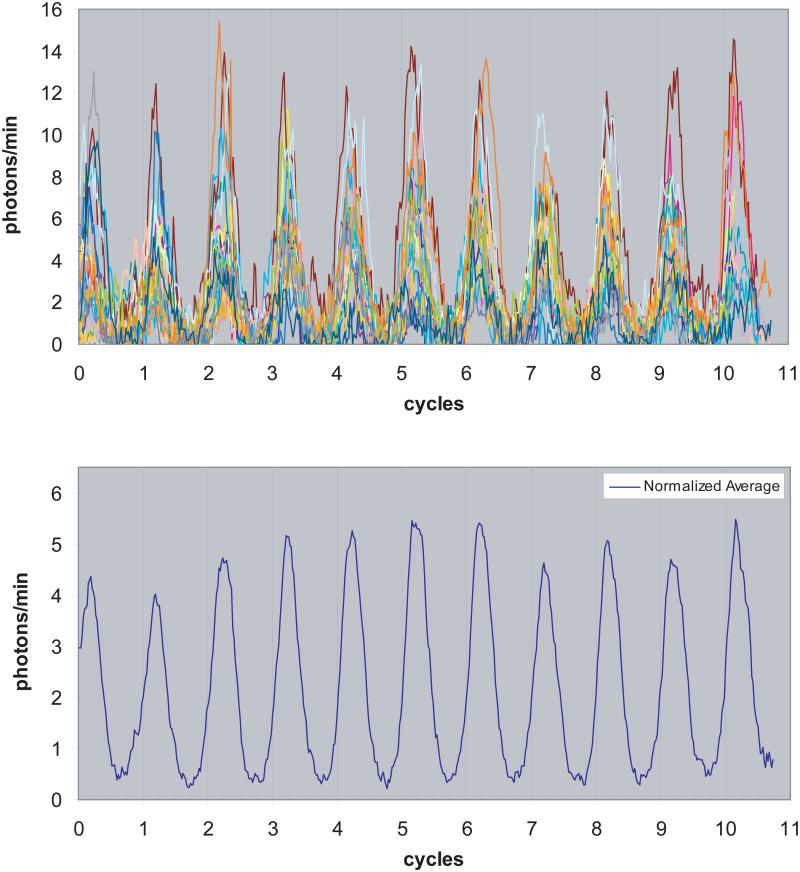
Figure 5.
Primary Fibroblast Rhythms Normalized by Period and Phase Luminescence rhythms of all 25 primary fibroblasts from one experiment were normalized by period and phase, by plotting luminescence as a function of circadian cycles for each cell, in order to reveal any overall trends in amplitude or waveform. Individual cell rhythms are plotted in the upper panel, a different color for each cell. The mean is plotted below, revealing a reasonably stable mean amplitude and waveform over the course of the 11 day experiment, and no damping.

