Figure 1.
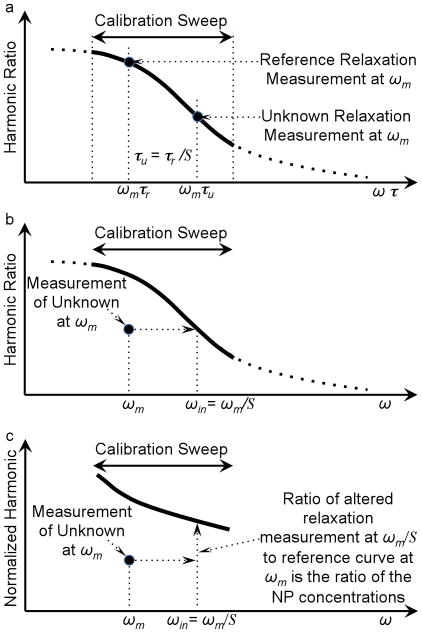
Diagram of the method of estimating the NP weight quantitatively by correcting for relaxation. a) The harmonic ratio as a function of ωτ for a reference ensemble of NPs measured over a range of frequencies, the calibration curve, and the harmonic ratio for an ensemble of NPs with an unknown relaxation time measured at frequency, ωτm. Recall from Eq. 5 the scale factor, S, as the ratio of the reference relaxation time, τr, over the unknown relaxation time, τu. In this example, the unknown sample has less rotational freedom so τu > τr so S < 1 and the harmonic ratio for the unknown sample shifts to the right on the curve shown in a). b) Harmonic ratios from a known reference sample and the sample with unknown relaxation as a function of ω. The scaling factor, S, is found scaling the harmonic ratio for the unknown sample so it is on the curve formed by the reference data. c) The harmonics normalized by frequency for both the reference sample and the unknown sample. The unknown is also shown shifted in frequency to compensate for the relaxation found in b). When shifted in frequency, the ratio of the signal from the unknown to that of the reference sample is the ratio of the weights of NPs in the two samples.

