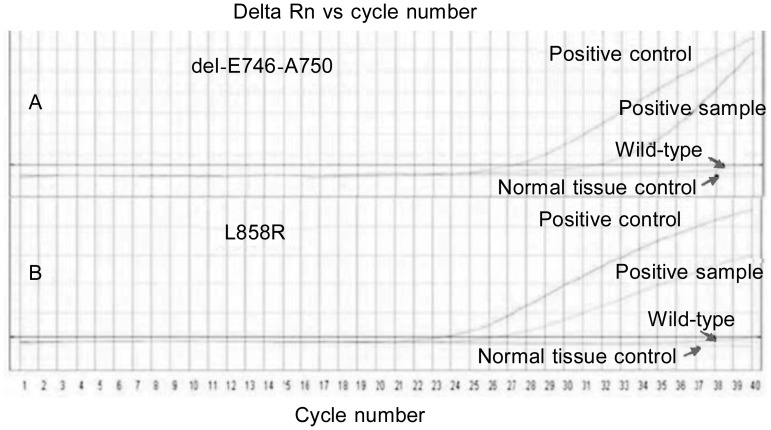
Figure 1. Representative real-time polymerase chain reaction (RT-PCR) curves for mutations in EGFR exons 19 and 21.
The positive control curve shows the mutation. Two ascending curves denoted “positive sample” represent exon 19 delE746-A750 mutation (A) and exon 21 L858R mutation (B). Smooth curves represent wild-type EGFR.

