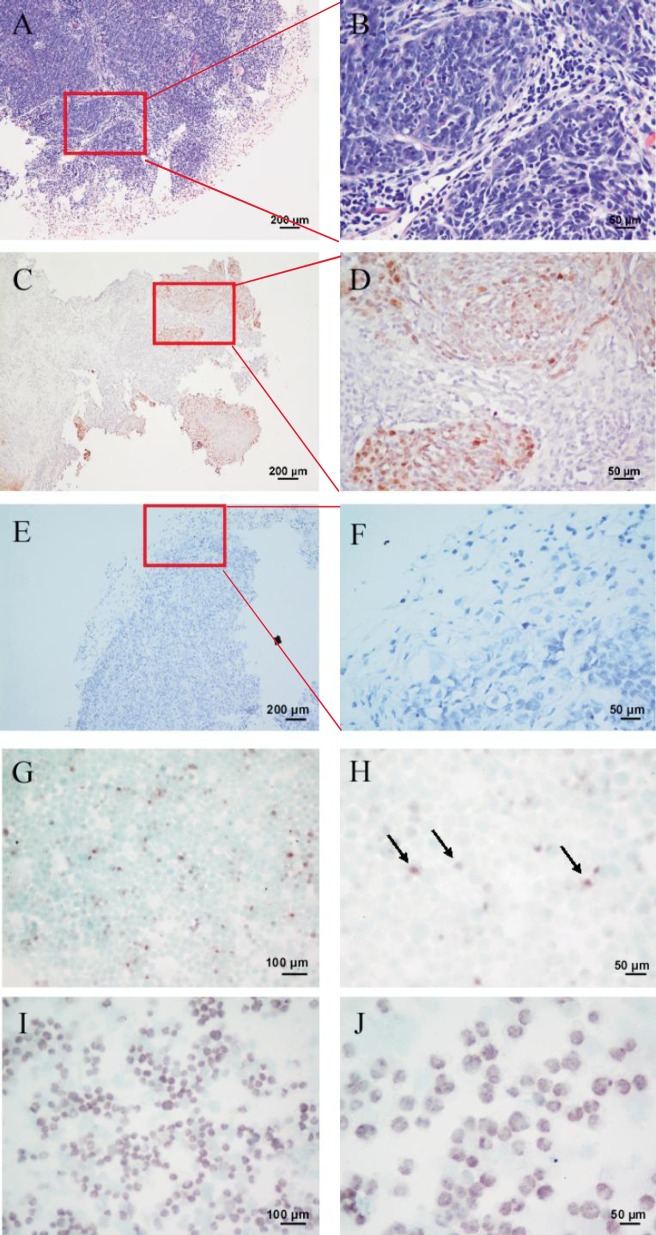
Figure 4. Detection of EBERs in the primary tumor specimen, xenograft model, and SUNE2 cells.
A, a paraffin-embedded section of the biopsy specimen shows tumor nests (HE ×100). B, a representative field shows obvious tumor nests, oval nuclei, and indistinct cell borders (HE ×400). C, a paraffin-embedded section of the biopsy specimen is EBER-positive (ISH ×100). D, a representative field of Panel C shows high EBER expression (ISH ×400). E, EBER in situ hybridization in a paraffin-embedded section of the xenograft was analyzed using Epstein-Barr Virus Probe ISH Kit (ISH ×100). F, a representative field of panel E shows negative EBERs expression (ISH ×400). EBER signal detection in both the biopsy specimen and xenograft was performed with the HRP/ DAB coloration kit (dark brown) (C–F). G, EBER in situ hybridization in SUNE2 cells (ISH ×200). H, a representative field shows high EBERs expression (ISH ×400). I, EBER in situ hybridization in C666 cells, which were used as a positive control (×200). J, a representative field shows EBERs expression (ISH ×400). EBER signal in both the SUNE2 and C666 cell lines was detected with the BCIP/NBT Alkaline Phosphatase Substrate Kit (dark violet-blue) (G–I).

