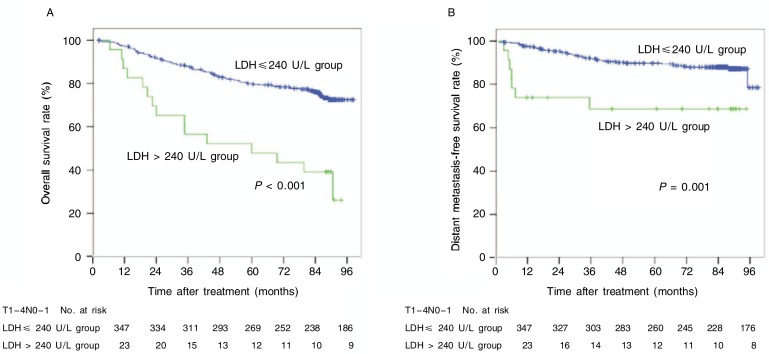
Figure 5. OS and DMFS curves of N0–1 NPC patients with different pretreatment levels of LDH.
A, 5-year OS rates were 43% in the increased LDH level group and 78% in the normal LDH level group (χ2 = 21.615, P < 0.001). B, 5-year DMFS rates were 68% in the increased LDH level group and 88% in the normal LDH level group (χ2 = 11.023, P = 0.001).

