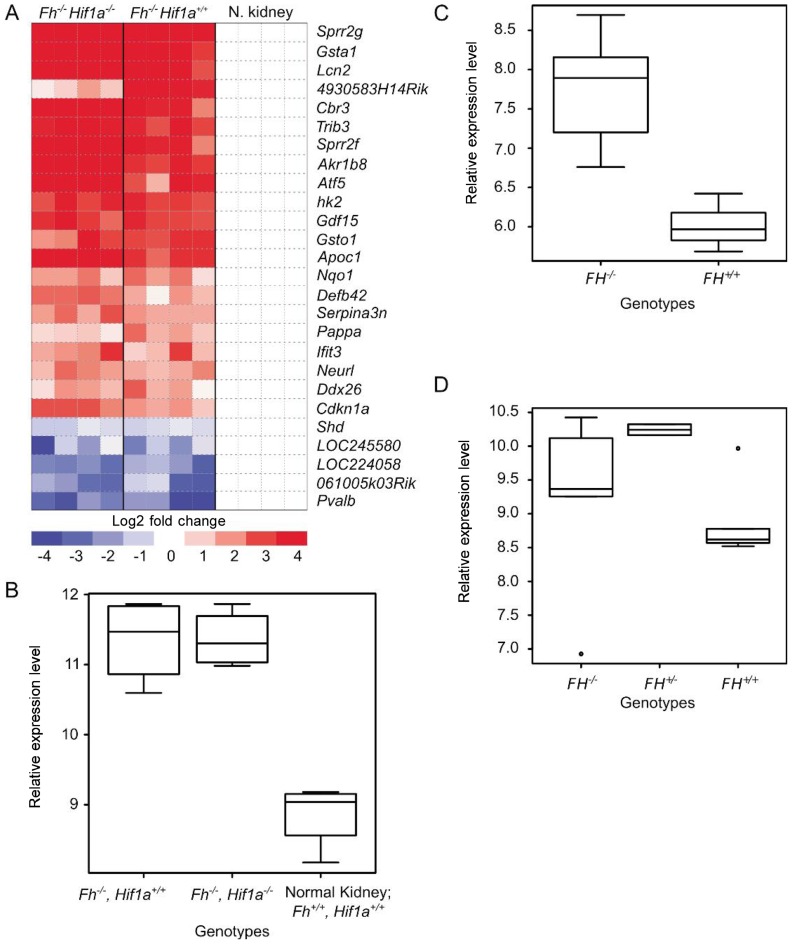
Figure 2. Gene expression profiles of tissues with FH inactivation.
A, differential expression of genes in renal tissues from normal vs. single or double knockout mice. Gene expression data previously published by Adam and co-workers; GSE29988[7]. B, expression of Hmox1 in the Fh knockout, Fh/Hif1a double knockout, and control mice. Gene expression data previously published by Adam and co-workers; GSE29988[7]. C, expression of HMOX1 in FH−/− and FH+/+ uterine fibroids. Gene expression data previously published by Vanharanta and co-workers; GSE2152[41]. D, expression of HMOX1 in hereditary type 2 papillary renal cell carcinoma (FH−/−), normal renal tissues from HLRCC patients (FH+/−), and normal renal tissues from non-HLRCC patients (FH+/+). Gene expression data previously published by Ooi and co-workers; GSE26574[6].

