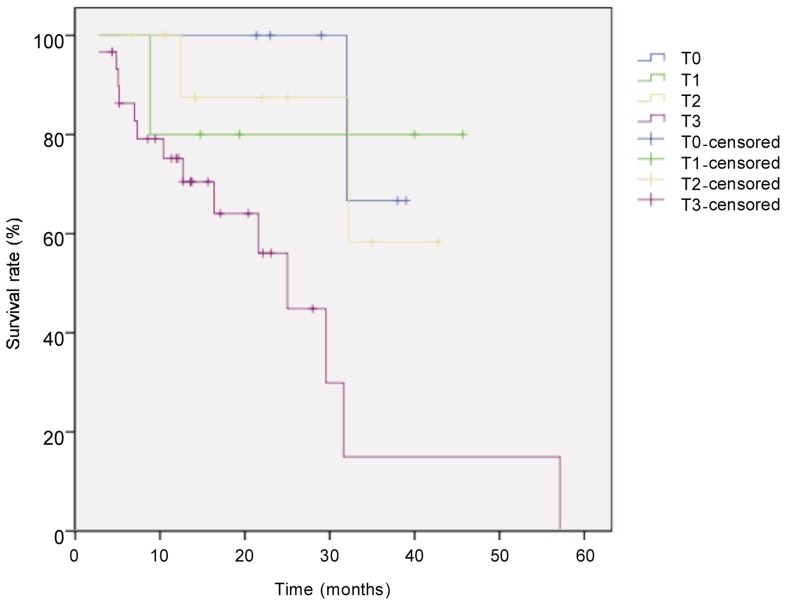
Figure 4. Kaplan-Meier overall survival curves for patients with locally advanced esophageal carcinoma of different pathologic T stage after neoadjuvant chemotherapy.
The difference between groups (T0, n = 6; T1, n = 5; T2, n = 11; T3, n = 30) was compared with the log-rank test. The survival rate was significantly higher in T0 group than in other groups (P = 0.026).

