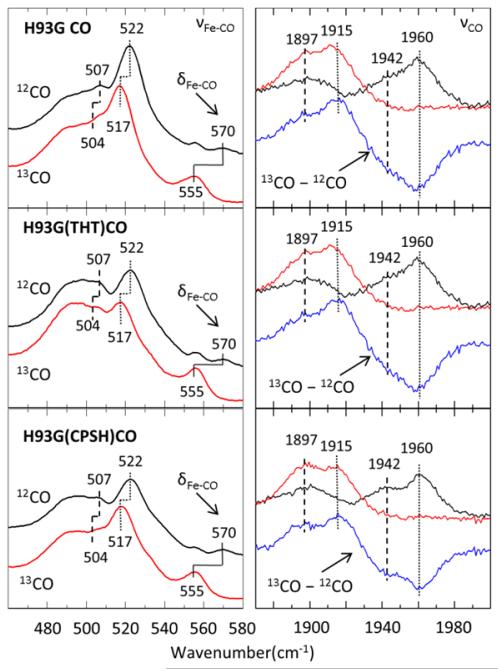
Figure 3.
Resonance Raman spectra of the νFe-CO and νCO modes of 12CO and 13CO bound H93G, H93G (THT) and H93G (CPSH). The low frequency Fe-CO stretching and bending region is in the left panels. The high frequency CO stretching is in the right panels and the 13CO – 12CO difference is shown in blue. Excitation wavelength is 413 nm and laser power at the sample is 11mw. The sample was in a cell spinning at 6000 rpm. Dashed and dotted lines indicate νFeCO modes of H93G(His)CO and H93G(H2O)CO respectively.

