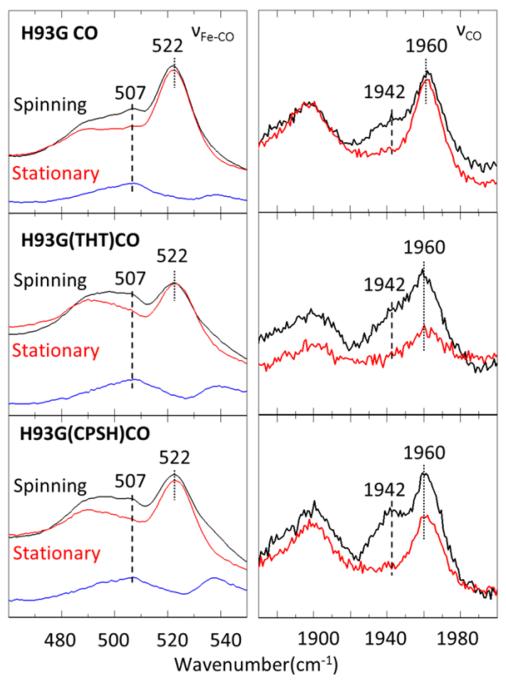
Figure 4.
Resonance Raman spectra of CO bound H93G with and without THT/CPSH. Spectra in black are taken with the sample spinning at 6000 rpm, while the red spectra are with a static cell. Panels on the left side show the 460-550cm−1 νFe-CO stretching band and the difference spectra in blue reveal the presence of the 507 cm−1 mode because of its increased photolysis compared to the 522 cm−1 species. Panels on the right side display the νCO stretching band and the analogous increased photolysis of the 1942 cm−1 species compared to the 1960 cm−1 species. The excitation wavelength is 413 nm and the laser power at the sample is 11mw.

