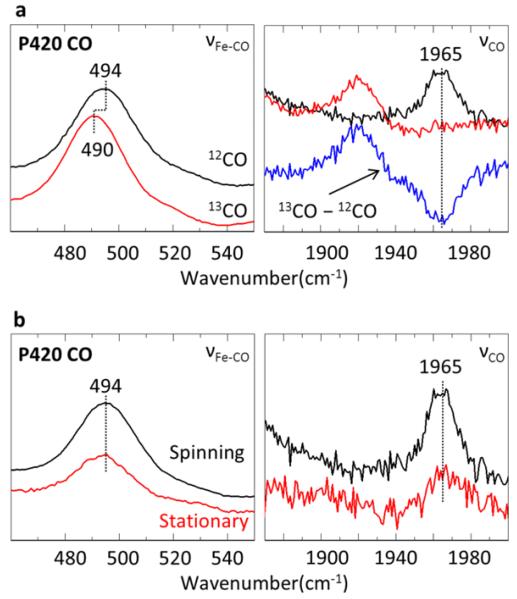
Figure 5.
(a) Resonance Raman spectra of the P420 12CO and 13CO adducts at λ=413nm. The power at the spinning sample cell is 11mw. The νFe-CO region is on the left and the νCO is on the right with the 13CO-12CO Raman difference spectra shown in blue. (b) Resonance Raman Spectra of P420 CO. Spectra in black are taken with the sample spinning at 6000 rpm, while the red spectra are with a static cell.

