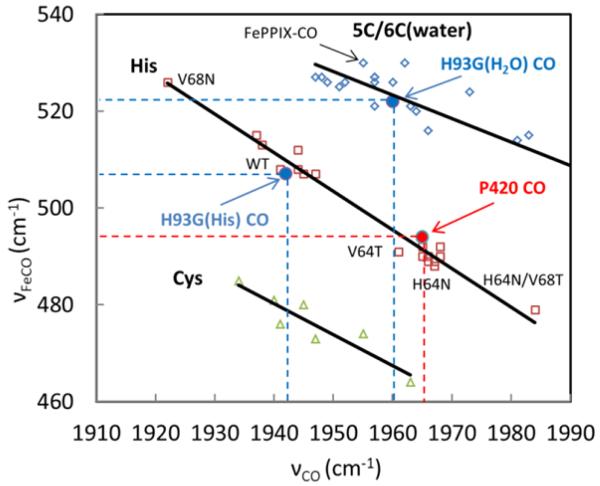
Figure 6.
Correlation plot of νFeCO and νCO with data from ref. 29-32. The red color open squares are for histidine (or imidazole) ligated heme systems. The open green triangles represent thiolate ligated heme systems. The open blue diamonds represent heme systems with a weak or absent proximal ligand. Three solid lines labeled 5C/6C(water), His, and Cys are the lines fitted to the data points. The solid blue and red dots are data points for H93G-CO and P420-CO from this work. The notation H93G(H2O)CO and H93G(His)CO correspond to the histidine and water ligated populations of H93G-CO observed in the H93G Raman spectra.

