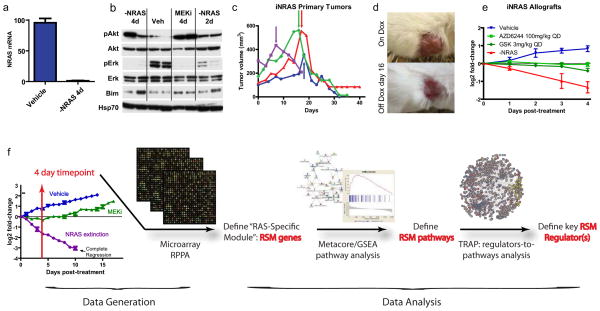
Figure 1. Characterization of the iNRAS mouse melanoma model and experimental design.
(a)Transgene mRNA levels following 4 days of doxycycline withdrawal in iNRAS melanomas, by RT-PCR.(b)Western blot of pAkt, Akt, pErk, Erk, and Bim from iNras-413 tumors. Hsp70 is a loading control. (c) Tumor volumes from four independent iNras primary tumors. Arrows indicate start of doxycycline withdrawal. (d) Representative gross appearance of tumors before and after doxycycline withdrawal, which leaves a non-malignant scar. Tumor is the same as the red line in (c). (e)The effect of two different MEK inhibitors or doxycycline withdrawal on allograft tumor growth from iNRAS cell line 475.(f) Flow chart of the experimental design. Transcriptome data comparing genetic NRASQ61K extinction and pharmacological MEK inhibition is processed through statistical and network analyses to generate a “RAS-Specific Module” of genes, pathways, and ultimately pathway regulators. The tumor growth chart is taken from Fig. 5b.

