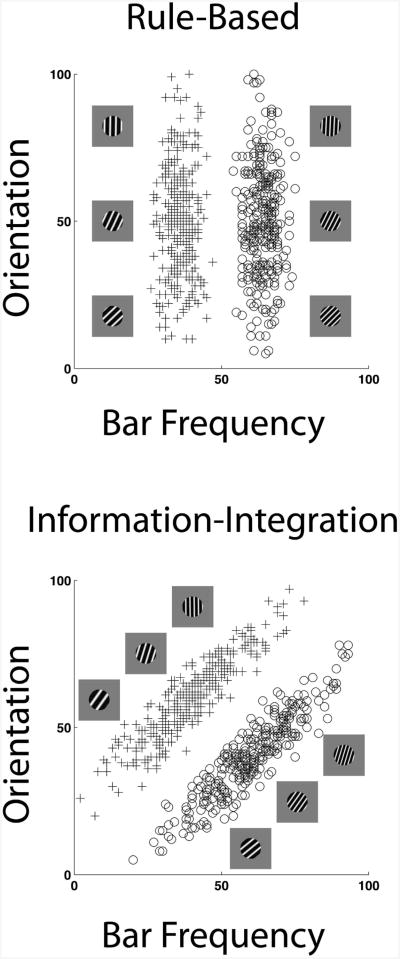
Figure 1.
Illustrating rule-based and information-integration category structures. The stimuli are sine-wave disks varying in bar spatial frequency and orientation. For each task, three illustrative Category A and Category B stimuli are provided. In addition, the plus signs and open circles illustrate the distribution of an experiment's stimuli as represented in an abstract space. The text specifies how these abstract values can be converted into physically realized stimuli. The pluses and circles, respectively, are Category A and Category B exemplars. In the top panel, only variation in bar frequency carries diagnostic category information, so optimal performance would be governed by a one-dimensional, bar-frequency rule (widely vs. narrowly spaced bars). In the lower panel, both bar frequency and orientation carry useful but insufficient category information—information from both dimensions would have to be integrated into category decisions.

