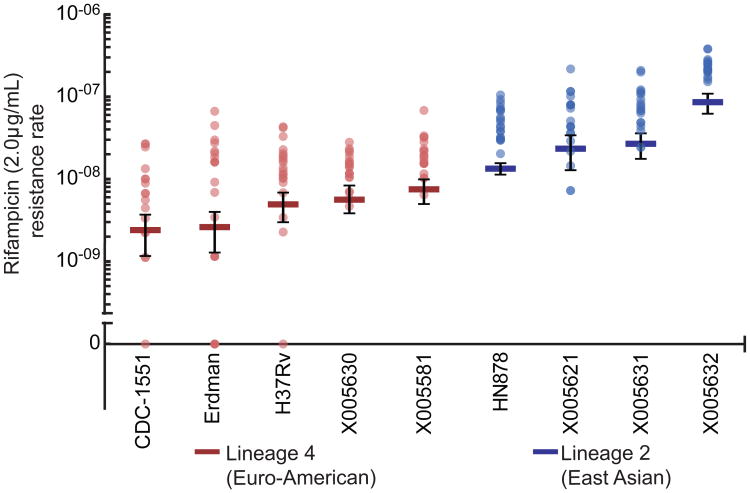
Figure 1. Lineage 2 strains more rapidly acquire rifampicin resistance.
Fluctuation analysis was used to determine the rifampicin (2μg/mL) resistance rate of clinical and laboratory strains from both Lineage 2 and Lineage 4. Strains from Lineage 4 are in red; strains from Lineage 2 are in blue. Circles represent mutation frequency (number of mutants per cell plated in a single culture), where darker circles represent multiple cultures with the same frequency. Bars represent the estimated mutation rate, with error bars representing the 95% confidence interval. Strains are displayed on the x-axis and the rifampicin resistance rate is displayed on the y-axis in log-scale. Values are listed in Supplementary Table 1.

